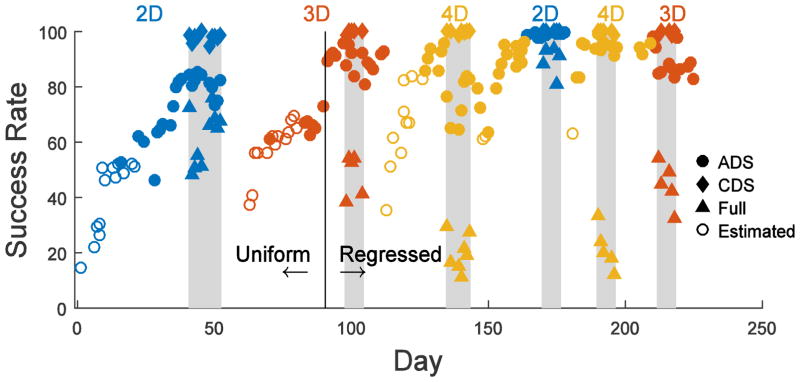
Figure 4.
Success rate across recording sessions during training (white regions) and experiment 1 (grey regions). The monkey was trained to control first the 2D, 3D, and then 4D virtual hand. Following this initial training, 2D, 4D, and 3D control were tested again. Open circles represent days when computer assistance was used, and the virtual hand was only partially controlled by the brain. For these days, the success rate has been estimated with post-hoc analysis of how the recorded neural signals would have performed without computer assistance. Initially, the decoding weights were uniform across all 16 channels. On day 91 (vertical black line), the uniform weights were replaced with regressed weights based on the previous day’s data. The grey regions are days when CDS (diamond) and full (triangle) control catch trials were performed in addition to standard trials performed with the ADS (circle) decoder.

