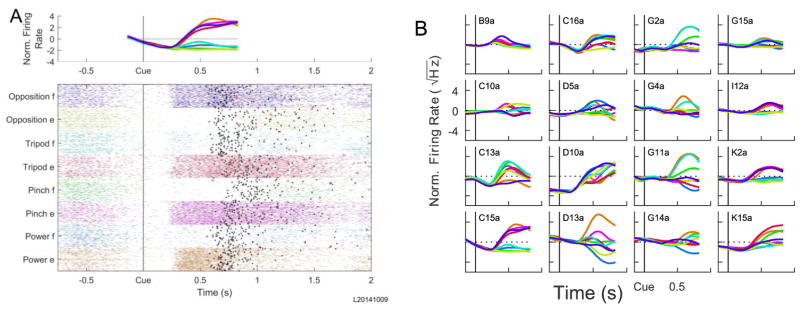
Figure 6.
Individual unit firing rates. A) A raster plot is shown of all observed action potentials for trials from a single 8 target, 4D session for an example unit (C15a). Trials are sorted by the eight target hand postures and aligned at the Cue (vertical black line). Black dots indicate when the correct target was contacted while larger red crosses indicate contact with an incorrect target. The mean normalized firing rate calculated by the online control algorithm as a function of time for the eight different trial types is plotted on top. B) The mean normalized firing rate for all 16 units used for control in the same session.

