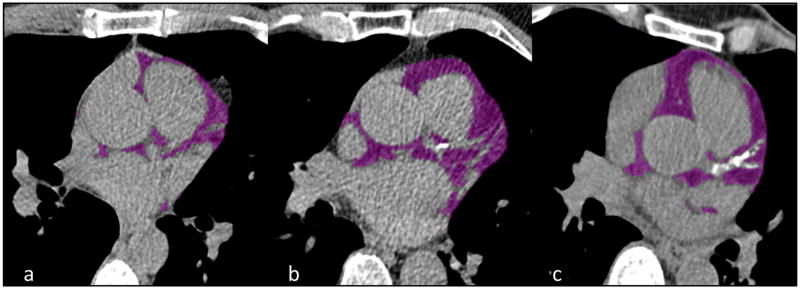
Figure 2.
Coronary calcium score (CCS) categories and epicardial adipose tissue (EAT) volume. Figure showing different degrees of CCS and EAT volume. Epicardial fat (purple) was identified on approximately the same slice in three different study individuals. The CCS and EAT volume increases from Figure 2a–2c. a CCS 0 and EAT volume 41 cm³, b CCS 73.8 and EAT volume 111 cm³, c CCS 538.6 and EAT volume 112 cm³.

