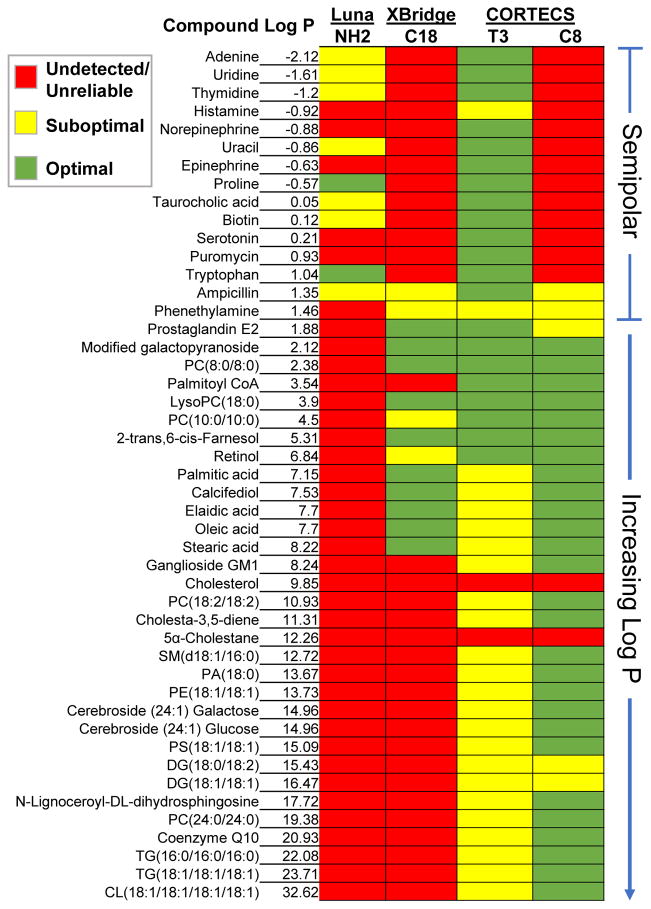
Fig. 1.
Comparison of 47 small-molecule standards between columns. The T3 demonstrated the best performance for semipolar standards. The C8 had the best performance for nonpolar standards. Combined, the two CORTECS methods had the best overall performance with 41 of the 47 standards being reliably detected. Red indicates that a standard was undetected, eluted in the void volume, or had an unreliable peak shape. Yellow indicates peak tailing or fronting, band broadening, or asymmetry (see Fig. 2 for examples).

