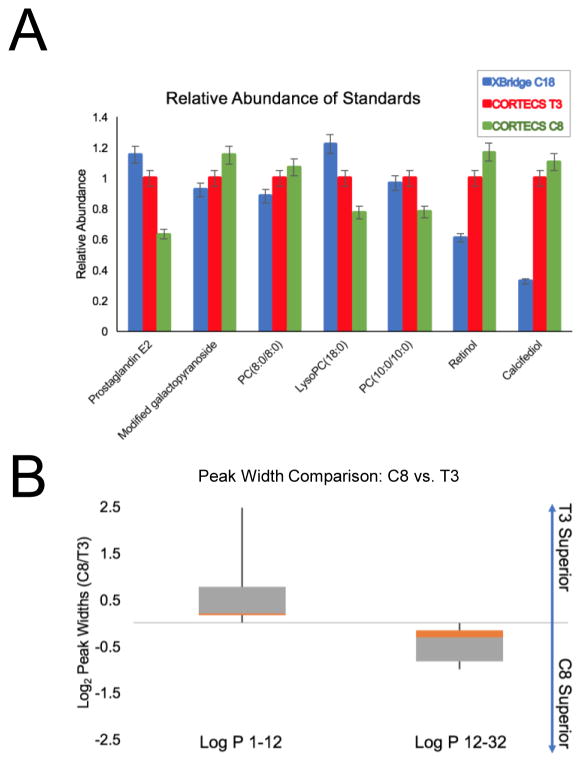
Fig. 3.
Comparison of peak intensities and widths between columns. A: Standards detected in XBridge C18, CORTECS T3, and CORTECS C8 experiments have similar intensities. See ESM (Table S1) for full chemical names of each standard. B: Ratio of standard peak widths detected on the CORTECS C8 and T3 methods with respect to low and high log P values.

