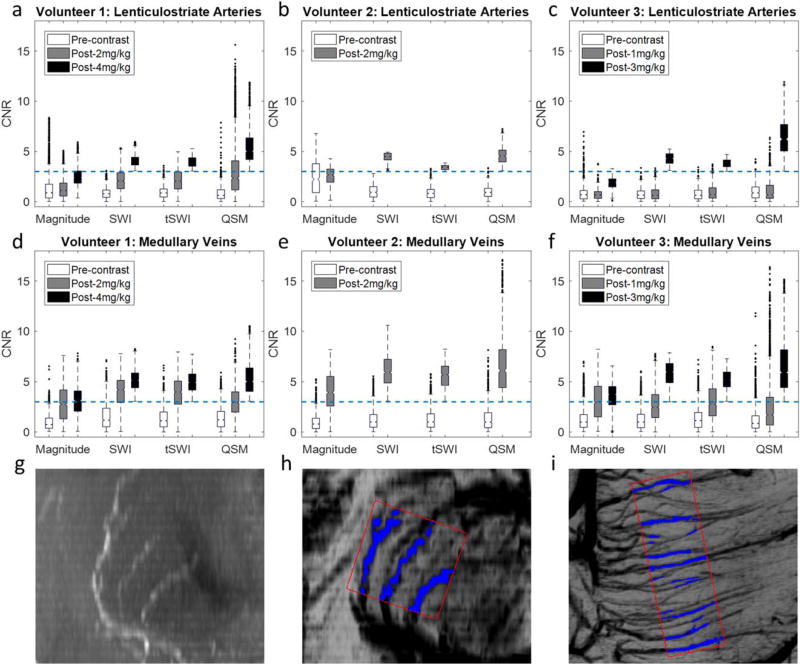
FIGURE 7.
Box-plots showing the distributions of the CNRs of pixels inside the lenticulostriate arteries (a–c) and the medullary veins (d–f) for each subject. The dashed blue lines in a to f correspond to CNR = 3. The selection of the pixels inside (blue regions) and outside (red boxes) the vessels was illustrated using Volunteer 1’s data (g–i). (g) MIP of the precontrast magnitude images showing the lenticulostriate arteries in the coronal view. (h) mIP of the post-4 mg/kg SWI data showing the same region as g. (i) mIP of the post-4 mg/kg SWI data showing the medullary veins in the axial view. g and h were generated by first interpolating the original data to isotropic resolution. The effective slice thickness was 12 mm in g to i.

