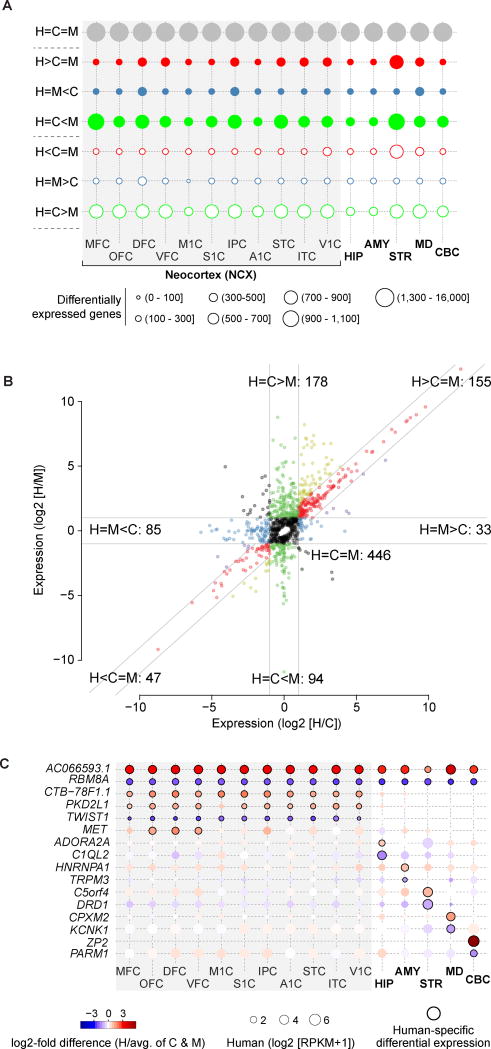
Fig. 1. Inter-species differential gene expression across sixteen brain regions.
(A) Bubble matrix showing the number of mRNA genes with conserved expression (grey circles), species-specific upregulation (filled circles), or downregulation (open circles). Post-hoc comparisons described in table S2. H – human; C – chimpanzee; M – macaque. (B) Inter-species patterns of normalized miRNA expression across all regions. Guidelines indicate ± 2-fold difference. (C) Examples of protein-coding and non-coding genes exhibiting global and regional human-specific upregulation (red and circles with black borders) or downregulation (blue and circles with black borders). Additional information and validations are provided in figs. S10–S12. OFC – orbital prefrontal cortex; DFC – dorsolateral prefrontal cortex; VFC – ventrolateral prefrontal cortex; MFC – medial prefrontal cortex; M1C – primary motor cortex; S1C – primary somatosensory cortex; IPC – inferior posterior parietal cortex; A1C – primary auditory cortex; STC – superior temporal cortex; ITC – inferior temporal cortex; V1C – primary visual cortex; HIP – hippocampus; AMY – amygdala; STR – striatum; MD – mediodorsal nucleus of the thalamus; CBC – cerebellar cortex.

