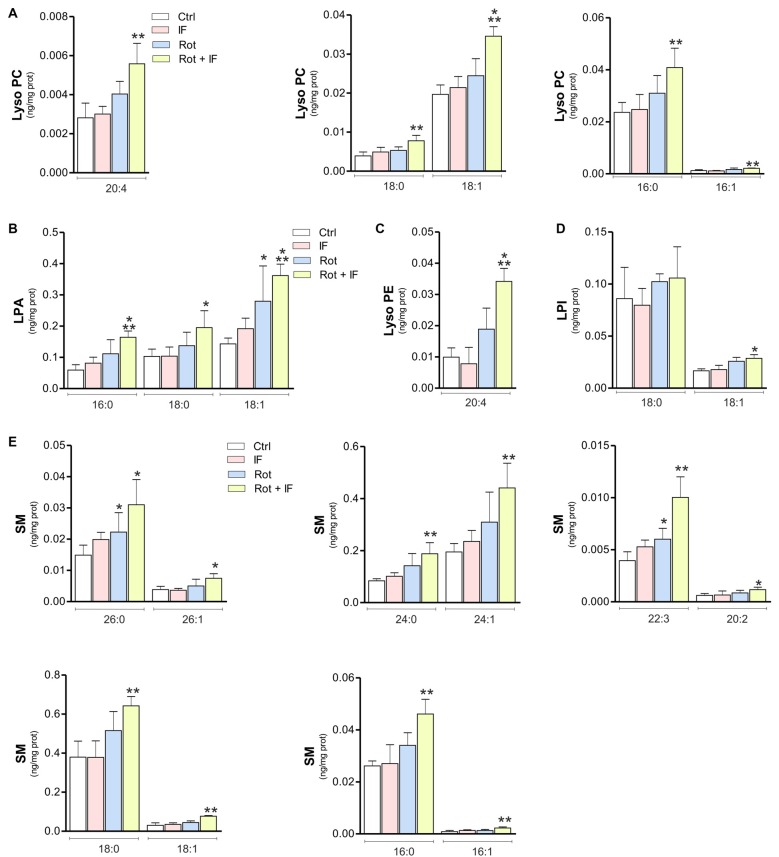
Figure 4.
Levels of inflammatory lysophospholipids and sphingomyelin (SM) are increased in mice treated with rotenone and subjected to IF. Brain regions containing SN were analyzed by LC-MS/MS. Levels of LPC coline species 20:4 (F(3,11) = 10.54; **p < 0.01 vs. Ctr), LPC 18:0 (F(3,11) = 11.52; **p < 0.01 vs. Ctr), LPC 18:1 (F(3,12) = 103.61; ***p < 0.001 vs. Ctr), LPC 16:0 (F(3,12) = 13.72; **p < 0.01 vs. Ctr) and LPC 16:1 (F(4,12) = 23.72; **p < 0.01 vs. Ctr) (A); lysophosphatidic acid (LPA) species LPA 16:0 (F(3,11) = 8.71; ***p < 0.001 vs. Ctr), LPA 18:0 (F(3,11) = 4.38; *p < 0.05 vs. Ctr) and LPA 18:1 (F(3,11) = 7.88; *p < 0.05, ***p < 0.001 vs. Ctr) (B); lysophosphatidyl ethanolamine (LPE) specie 20:4 (F(3,7) = 12.88; ***p < 0.001 vs. Ctr) (C); lysophosphatidyl inositol (LPI) species LPI 18:0 and LPI 18: 1 (F(3,11) = 10.63; *p < 0.05 vs. Ctr) (D); SM species SM 26:0 (F(3,11) = 5.78; *p < 0.05 vs. Ctr), SM 26:1 (F(3,11) = 4.97; *p < 0.05 vs. Ctr), SM 24:0 (F(3,11) = 7.39; **p < 0.01 vs. Ctr), SM 24:1 (F(3,11) = 8.49; **p < 0.001 vs. Ctr), SM 22:3 (F(3,11) = 17.14; *p < 0.05, **p < 0.01 vs. Ctr), SM 20:2 (F(3,11) = 2.78; *p < 0.05 vs. Ctr), SM 18:0 (F(3,11) = 8.01; **p < 0.01 vs. Ctr), SM 18:1 (F(3,11) = 17.56; **p < 0.01 vs. Ctr), SM 16:0 (F(3,11) = 10.25; **p < 0.01 vs. Ctr) and SM 16:1 (F(3,11) = 8.49; **p < 0.01 vs. Ctr) (E). Data expressed as means ± SD (n = 3 for Rot + IF group; n = 4 for the other groups).

