Figure 1.
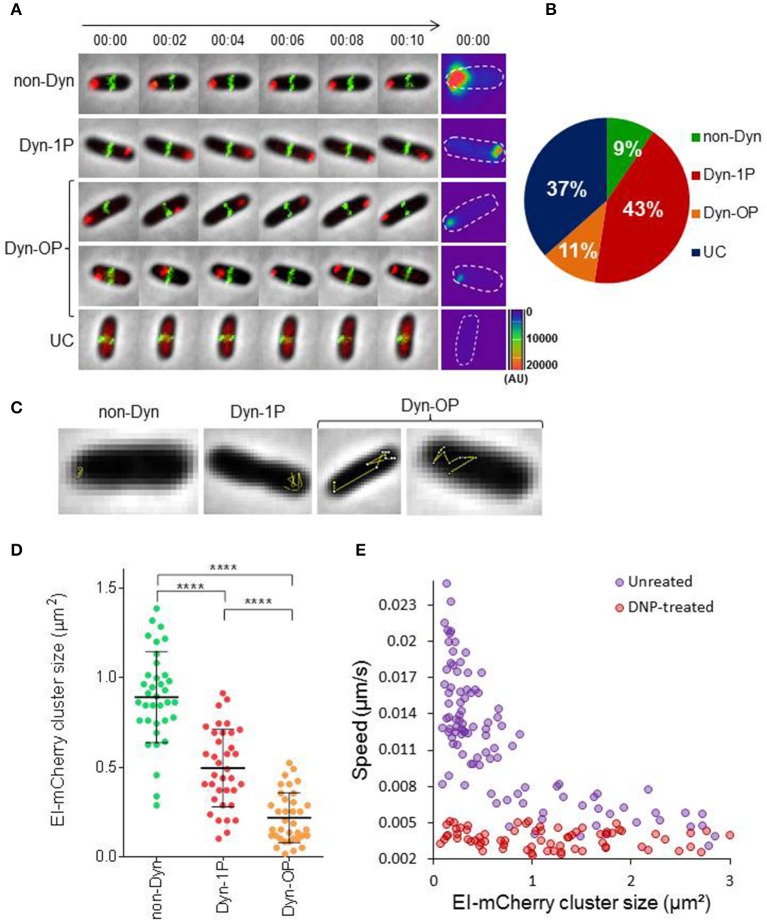
EI is a dynamic protein whose motion is metabolism-dependent (A) Time-lapse microscopy images of wild-type E. coli cells expressing EI-mCherry and ZapA-GFP. Representative images of the four different patterns of EI dynamics are shown: (a) non-dynamic (non-Dyn), (b) dynamic within one pole (Dyn-1P), (c) dynamic between the two poles or from pole to midcell (Dyn-OP), (d) undetectable cluster (UC). The mCherry and GFP fusion proteins were observed by fluorescence microscopy and cells were observed with phase microscopy. Overlays of the fluorescence signal (GFP, green and mCherry, red) over the phase contrast images (gray) are shown. Surface intensity plots showing the fluorescent intensity (AU) of the EI-mCherry signal at time 0, which corresponds to the cellular distribution of EI-mCherry in each of the cells. The contour of each cell is outlined. (B) Pie chart showing the fractions of cells that exhibit the different patterns of EI dynamics, i.e., non-dynamic (non-Dyn, green), dynamic within one pole (Dyn-1P, red), dynamic from pole to midcell or from pole to pole (Dyn-OP, orange), and undetectable cluster (UC, blue), in populations grown to early log in minimal medium supplemented with glucose as carbon source. The Standard division was between 1 and 2%. (C) Two-dimensional trajectories of EI-mCherry cluster movement overlaid on the corresponding phase contrast (gray) images. (D) Distribution diagram indicating the distribution of EI-mCherry clusters area (μm2) in cells (referred to as size) exhibiting the different patterns of EI dynamics (40 cells from each group). P-values were obtained by ordinary one-way ANOVA: ****p-value < 0.0001. (E) Scatter plot of cluster speed (μm/s) vs. EI-mCherry clusters area (μm2), drawn for cells treated (red) or not treated (purple) with DNP. See Materials and Methods for experimental details. Spearman correlation for the untreated ρ = −0.78, p-value < 10−8.

