Figure 3.
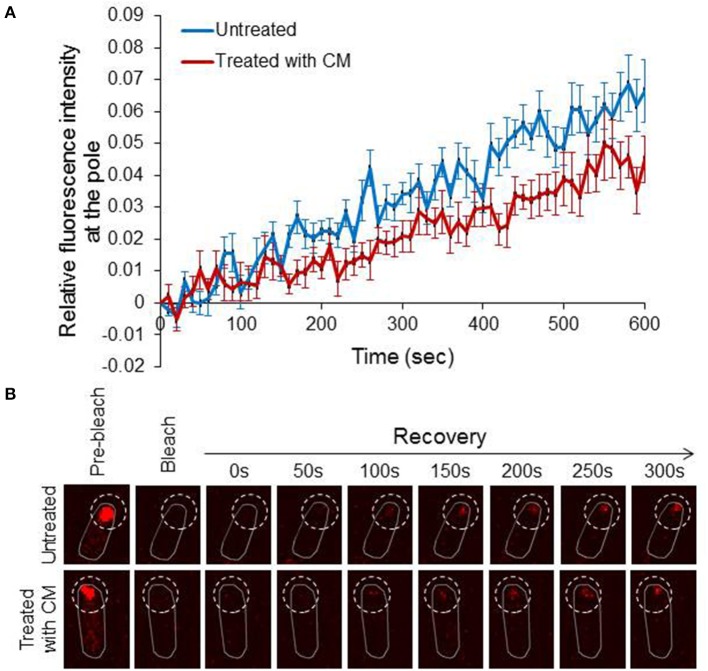
Diffuse EI molecules dynamically incorporate into polar clusters (A) Line chart showing the recovery of EI-mCherry fluorescence signal in untreated cells (blue) (n = 14) or in chloramphenicol-treated cells (red) (n = 12) from the time of bleaching (time 0) over 600 s. Mean and standard error are shown. (B) Representative FRAP microscopy images of wild-type E. coli cells expressing EI-mCherry in the absence of treatment (upper panel) or in the presence of chloramphenicol (lower panel). Images at selective time points are shown. The contour of the bleached area in the fluorescent images is outlined.

