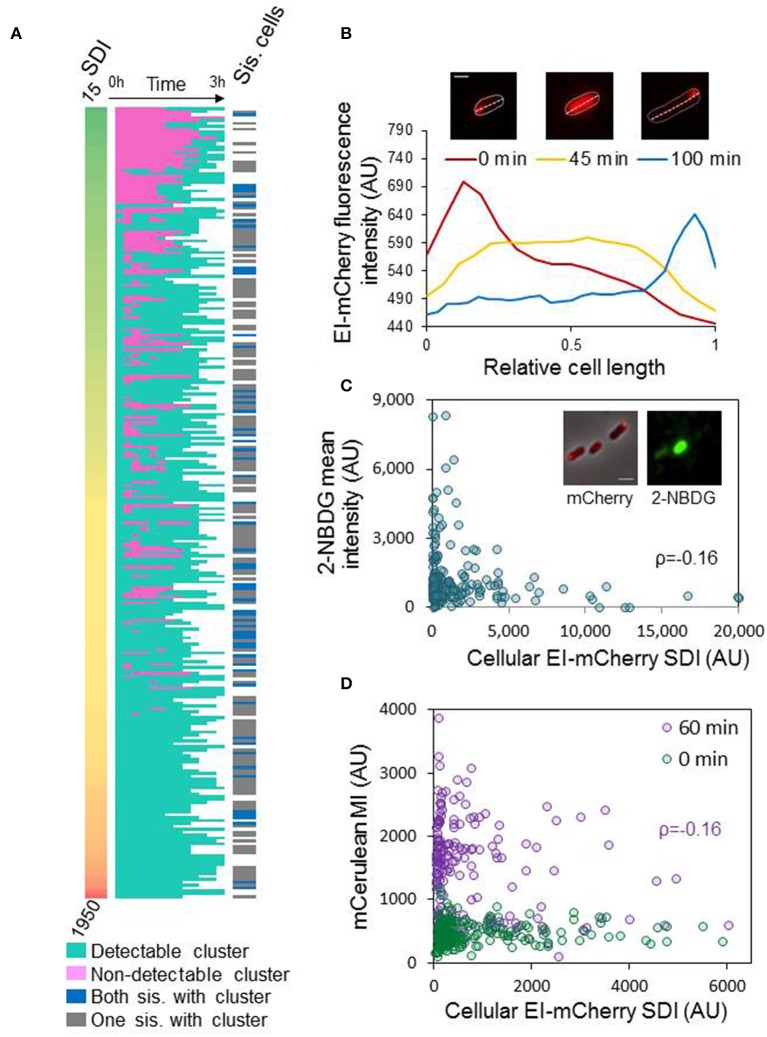
Figure 5.
Assembly of EI into clusters affects EI function and dynamics (A) Diluted ON cultures were spotted on an agar pad with fresh medium and the cells were observed at time 0, and every 15 min till they divided or for 3 h, by time-lapse microscopy. Left panels: heat map of standard deviation intensity (SDI) of EI-mCherry at time 0. Middle panels: heat map of cells with (turquoise) or without (pink) detectable EI-mCherry clusters over time, from time 0 till cell division (white, time after cell division). Right panels: Heat map of dividing cells with a cluster in each sister cell (blue) or only in one of the sister cells (gray) after 3 h; white rows denote cells that did not divide within the 3 h. (B) The images show a representative cell from the ON population, which has an EI-mCherry cluster at time 0 that completely disperses during growth (see image after 45 min) and later reforms (see image after 100 min). The contour of the cell is outlined. Scale bar corresponds to 1 μm. The plot shows the EI-mCherry intensity in this cell vs. the relative cell length at the different time points at which the images were taken (0, 45, and 100 min). (C) The images show a representative cells from the ON population, which express EI-mCherry, that were incubated with the glucose analog 2-NBDG. The mCherry fusion protein (red) and the 2-NBDG (green) were observed by fluorescence microscopy and are shown over the phase contrast images (gray) that were observed with phase microscopy. Scale bar 2 μm. The scatter plot presents the 2-NBDG mean intensity (AU) vs. the EI-mCherry SDI (AU) (n = 194). Pearson correlation ρ = 0.16; p-value = 0.02. (D) The scatter plot shows the mean intensity (MI) of mCerulean expressed from Pnag, vs. the cellular EI-mCherry SDI (AU) at the moment of transition to NAG-continuing medium (0 min; green cycles; n = 222) and after an hour (60 min; purple cycles; n = 274). Pearson correlation for the “60 min” plot ρ = −0.16; p-value = 0.007. Pearson correlation for the “0 min” plot ρ = 0.06; p-value = 0.366.

