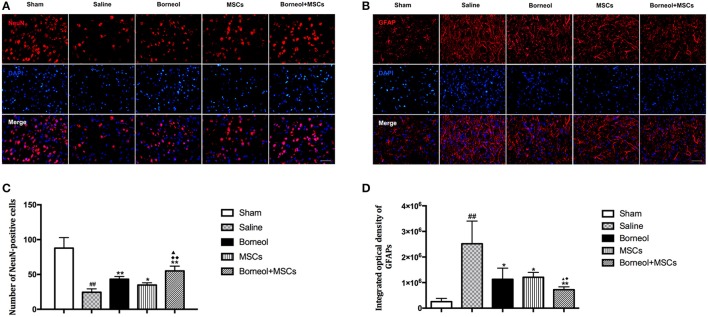
Figure 6.
Effect of borneol and MSCs transplantation on neurons and astrocytes at 14 d after MSCs transplantation. (A) Photomicrographs (*400) of NeuN positive cells in infarct zone. (B) Photomicrographs (*400) of GFAP positive cells in the lesion border. (C) Quantitative analysis of the number of NeuN positive cells. Data were expressed as mean ± SD. ##P < 0.01 compared with sham group; *P < 0.05, **P < 0.01 compared with MCAO plus saline group; ▴P < 0.05 compared with borneol group; ♦♦P < 0.01 compared with MSCs group. (D) Quantitative analysis of the number of GFAP positive cells. Data were expressed as mean ± SD. ##P < 0.01 compared with sham group; *P < 0.05, **P < 0.01 compared with MCAO plus saline group; ▴P < 0.05 compared with borneol group; ♦P < 0.05 compared with MSCs group.

