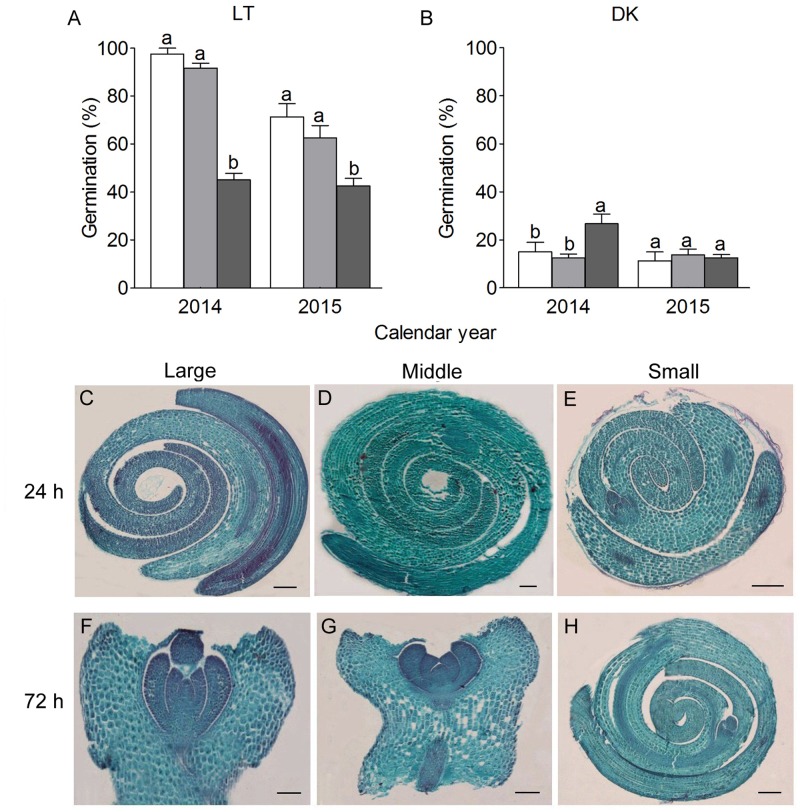
FIGURE 3.
Seed germination and the morphological changes of heteromorphic seed of S. ferganica. (A,B) Germination percentage of heteromorphic seeds in light or dark in February of the next year of 2014 and 2015, respectively. Bars with different lowercase letters indicate significant differences (P < 0.05) according to the Tukey’s test. Values are means ± SE of four replicates in (A,B). (C–H) Longitudinal cross section of seed; (C,F) large seed; (D,G) middle seed; (E,H) small seed. (C–E) Germination for 24 h. (F–H) germination for 72 h. Scale bars: (C–E) 200 μm, (F–H) 100 μm.

