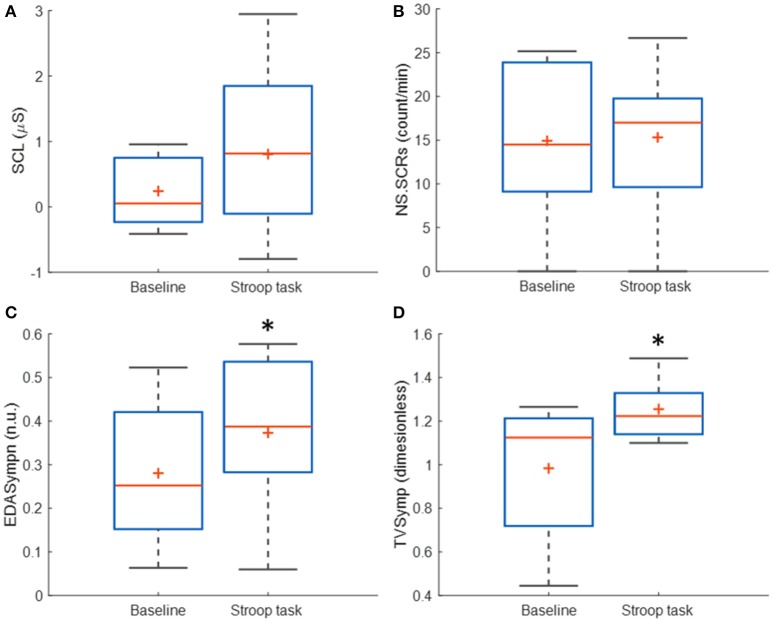
Figure 3.
Box plots of the time-domain and frequency-domain measures of EDA for baseline and Stroop task stages, for N = 14 subjects immersed in water. (*) Represent significant differences between stages. (A) SCL, skin conductance level; (B) NS.SCRs, non-specific skin conductance responses; (C) EDASympn, normalized power spectra in the 0.045 to 0.25 Hz band; (D) TVSymp, time-varying index of EDA.

