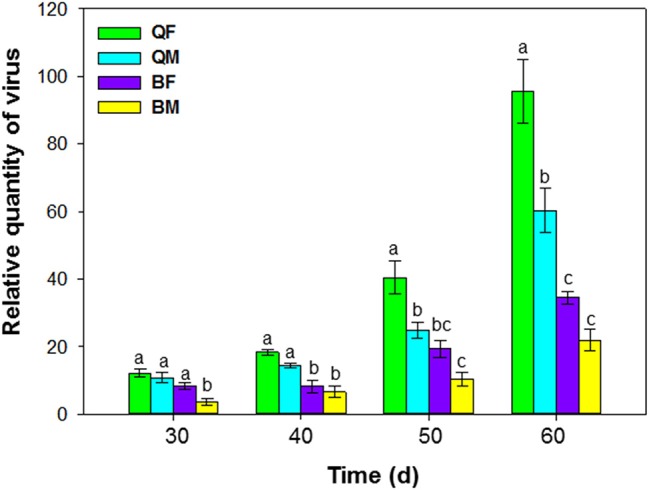
Figure 3.

Accumulation of tomato chlorosis virus in tomato following transmission by B. tabaci MEAM1 and MED. QF, MED females; QM, MED males; BF, MEAM1 females; BM, MEAM1 males. The Y axis values refer to the relative quantity of virus detected in the two youngest leaves of each replicate plant. Values are means ± SE. For each time, means with different letters are significantly different (P < 0.05; N = 10).
