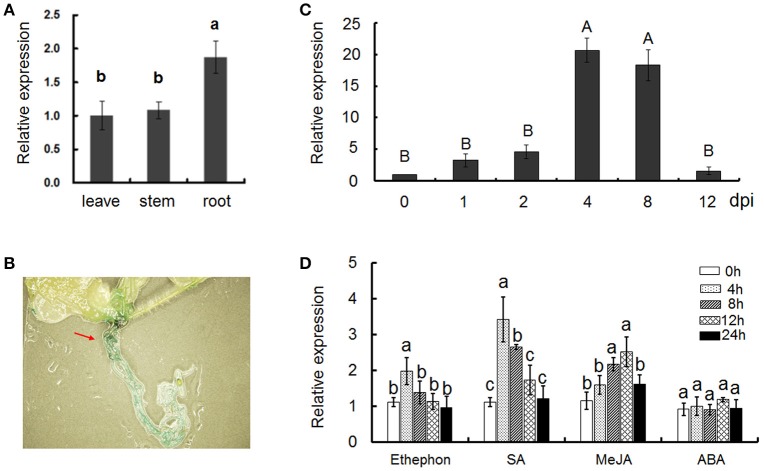
Figure 2.
Expression pattern analysis of the Gbvdr6 gene. (A) The transcript levels of Gbvdr6 in different tissues of Hai7124. Values were expressed as fold changes of transcript levels in the different tissues with respect to that of leaves with the 2−ΔΔCT Method. Error bars represented SE of three biological replicates. Duncan's multiple range test was conducted, and the different letters in graphs indicate significant differences between treatments (P < 0.05). (B) Gus activities in transgenic Arabidopsis plantlets containing the pGbvdr6: Gus construct. (C) The expression patterns of Gbvdr6 in response to infection by V. dahliae. The transcript levels of Gbvdr6 were measured by real-time reverse-transcription PCR with the UBQ14 gene as the internal control. Values were expressed as fold changes of transcript levels in the V. dahliae inoculated samples at fixed point of time with respect to that in non-inoculated samples at 0 dpi with the 2−ΔΔCT Method. Error bars represented SE of three biological replicates. Kruskal-Wallis test was conducted, and the different letters in graphs indicate significant differences between treatments (P < 0.01). (D) The expression patterns of Gbvdr6 in response to phytohormones. Values were expressed as fold changes of transcript levels in the phytohormones treated root samples at fixed point of time with respect to the transcript levels in the mock samples. Error bars represented SE of three biological replicates and the different letters in graphs indicate significant differences after treatments (P < 0.05).

