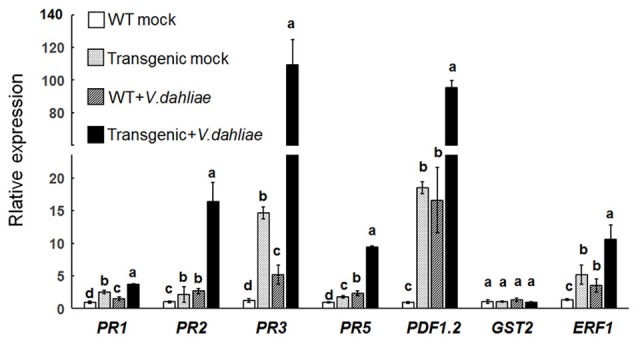
Figure 5.

Upregulation of pathogenesis-related genes in the Gbvdr6 over-expressed Arabidopsis. The expression levels of marker genes PR1, PR2, and PR5 in SA signaling, PR3, PDF1.2, and ERF1 in ET/JA signaling, and GST2 in ET signaling were measured by real-time reverse-transcription PCR with β-tubulin gene as the internal control. Data were the means ± SE of three biological replicates. Duncan's multiple range test was carried out within genes, and different letters in the graphs indicate significant differences between treatments (P < 0.05).
