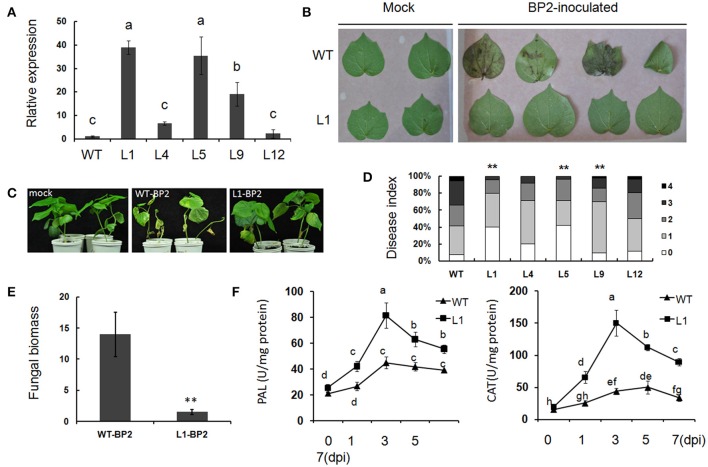
Figure 7.
Gbvdr6 over-expressed cotton enhanced resistance to V. dahliae. (A) Varied expressional levels of Gbvdr6 in the transformed plants. Gbvdr6 relative expressional levels of the T3 generation were measured by qRT-PCR and calculated in relation to the wild type plants according to the ΔΔCt method with the UBQ14 gene as the internal control. L1, L4, L5, L9, and L12 are the transgenic cotton lines. Different letters on the bars designate statistically significant differences (P < 0.05) according to Duncan's multiple range test. (B) Leaves of Gbvdr6 over-expressed cotton (L1) and wild type inoculated with V. dahliae in vitro. The photos were taken at 5 days after inoculation. (C) The Gbvdr6 over-expressed cotton inoculated with V. dahliae in vivo. The photos were taken at 15 days after inoculation. (D) Assay of disease index of transgenic lines and wild type by the V. dahliae isolate BP2. The degree of disease was divided into five grades with disease scores ranging between 0 and 4, and fisher's exact test was conducted to determine whether there is a significant difference between the WT and transgenic lines. The asterisk indicated above the columns means **P < 0.01. (E) Fungal biomass upon inoculation with V. dahliae isolate BP2. It was determined by qRT-PCR, and the bars represent Verticillium ITS transcript levels relative to the cotton UBQ14 gene. Data were the means ± SE of three biological replicates and significant differences by Student's test for P < 0.01 are indicated by double asterisks. (F) Enzyme activity of PAL and CAT of the Gbvdr6 over-expressed and WT plants after the inoculation of V. dahliae isolate BP2. Duncan's multiple range test was conducted, and the different letters in graphs indicate significant differences (P < 0.05).

