Figure 2.
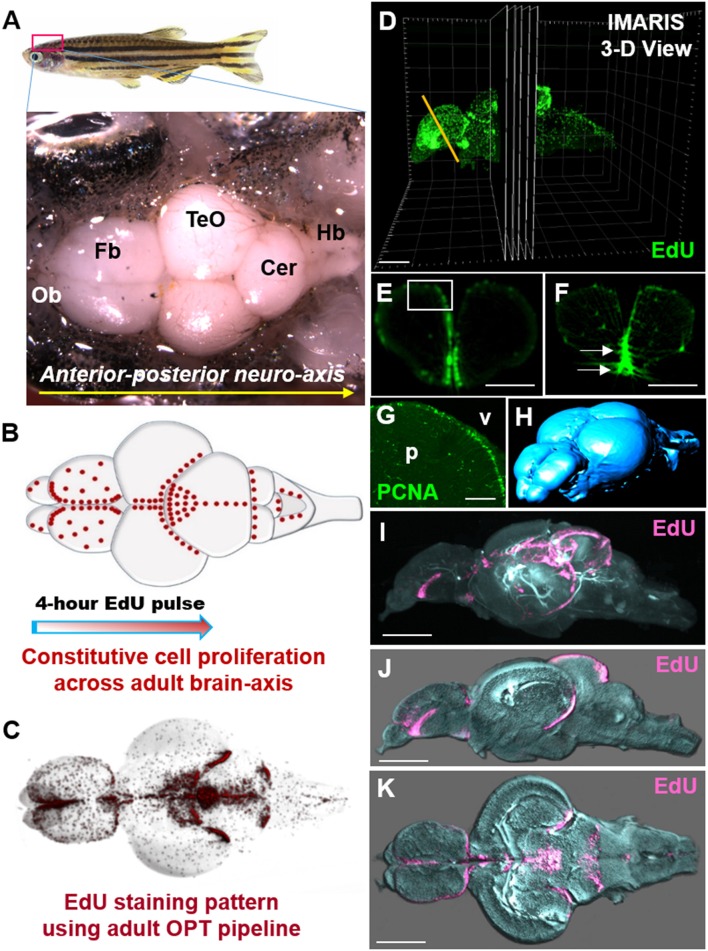
Whole brain EdU labeling and 3-dimensional OPT scanning recapitulates the constitutive pattern of cell proliferation in the adult zebrafish brains. (A) Dorsal view of adult zebrafish brain displaying major structures along the A-P neuro-axis. Ob, olfactory bulbs; Fb, forebrain; TeO, optic tectum; Cer, cerebellum; Hb, hindbrain. (B) Schematic dorsal view of adult brain showing the known constitutive pattern (Kaslin et al., 2008) of cell proliferation (red dots) along the brain axis following a 4-h EdU chase. (C) Dorsal view of EdU staining using our adult OPT pipeline demonstrating the same labeling pattern across the brain axis as in (B). (D) Example of IMARIS 3-D visualization output of an adult EdU injected brain (green) illustrating the ability to visualize or analyse regions of interest in cross-section (or other planes). Yellow line depicts level of telencephalic cross-section shown in (E,F). (E,F) Cross-sections through the adult zebrafish telencephalon showing examples of optimal (E; near cellular resolution) and suboptimal (F) EdU staining (green)/OPT imaging along the periventricular neurogenic niche following data reconstructions. White box in (E) denotes dorsal telencephalic domain shown in (G). White arrows in (F) show EdU that was over-exposed during scanning, while the slightly fussy image indicates that the post-processing software reconstruction was of poor quality. (G) Antibody labeling using Proliferating Cell Nuclear Antigen (PCNA) displaying the homeostatic pattern of cell proliferation at the dorsal telencephalon from cryosectioned, confocal-imaged tissue. Note that labeling is restricted to the stem cell niche adjacent the forebrain ventricle (v) with little to no staining within the parenchyma (p). (H) Anterior-dorsal view of iso-surface rendered adult brain (blue) using IMARIS software derived from initial OPT autofluorescence scans of brain contour. (I–K) Constitutive brain EdU labeling (pink) across the neuro-axis merged with an autofluorescence scan of brain morphology/volume (pale blue) shown in mid-sagittal (I,J) and horizontal (K) views. In (J,K) images were rendered in IMARIS. Scale bars: (E,F) = 300 μm; (G) = 150 μm; (D,I–K) = 500 μm.

