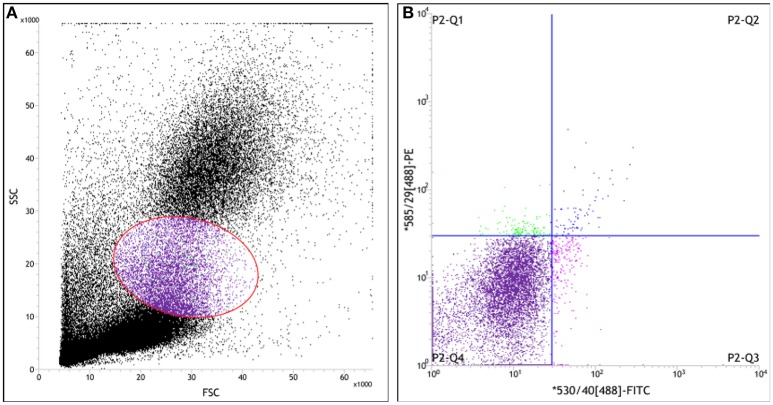
Figure 2.
Scatter diagram of leukocyte measured by flow cytometry in the peripheral blood of rat. Whole fresh blood samples anti-coagulated by EDTA.2Na were incubated with PE-conjugated anti-CD34 antibody and FITC-conjugated anti-vWF antibody. Then hemolysin was dissolved in distilled water, and applied to cells at the final concentration 10% (v/v). (A) The forward-scatter (FSC) and side-scatter (SSC) diagram, Cells in gate represent the mononuclear cells; (B) The fluorescence intensity scatter diagram. MNCs that were positively identified as CEPC by immunofluorescent staining for the PE+/FITC+ or CD34+/vWF+ (P2-Q2) represent EPC.

