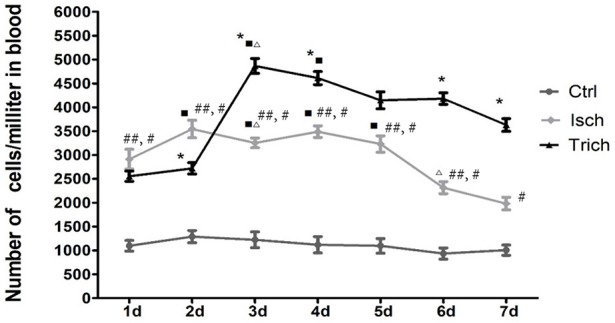
Figure 4.

Effect of TAPE on the mobilization of EPC in AMI rats, change in the content of CEPC in each group of rats in 7 days after AMI. Rats in each group were randomly subdivided into seven subgroups, the 1st−7th subgroup. On the 1st−7th day next AMI modeling, rats in the 1st−7th subgroups were selected to be phlebotomized from their celiac artery after being anesthetized by chloral hydrate, respectively. FCM was performed to quantify CEPC with whole fresh blood sample of each rat. Ctrl, Isch, and Trich, represent the CEPC counts per milliliter blood in the rats of control group, the model group and the trich group, respectively; 1 d−7 d, represents the 1st−7th day next the coronary ligation or sham operation; # or ##, P < 0.05 or P < 0.01, compared with the control group; * or **, P < 0.05 or P < 0.01, compared with the model group. Each data represents the average of group of 8 rats, and vertical lines indicate the standard error of the mean (SEM).
