Figure 2.
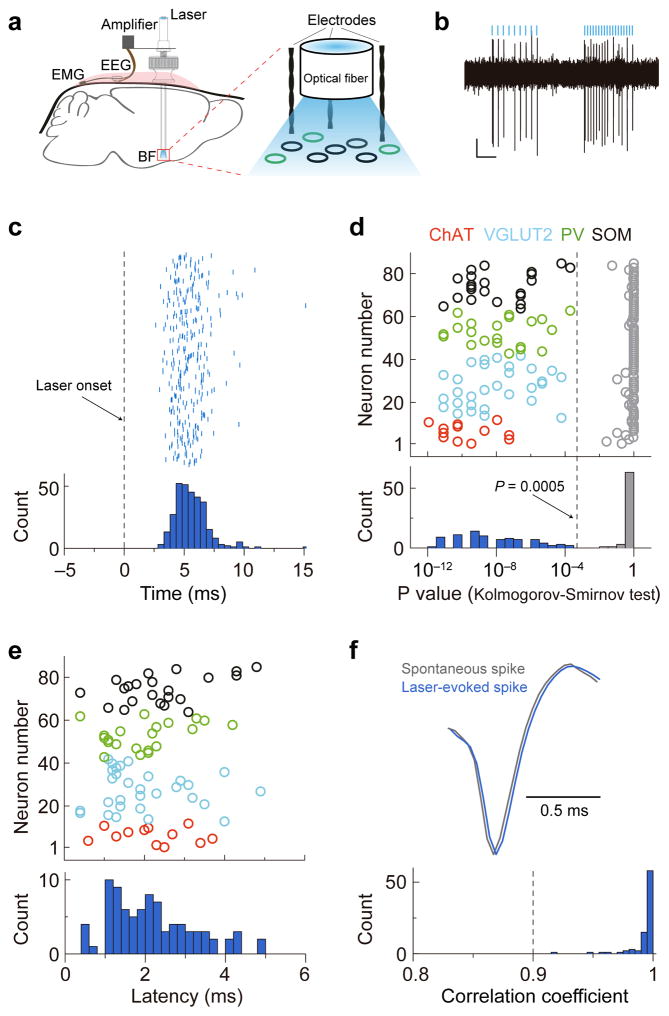
Identification of BF cell types using ChR2 tagging and optrode recording. (a) Schematic of optrode recording in freely moving mice. (b) Example recording of laser-evoked spiking in ChAT-ChR2 mice. Blue lines, laser pulses (5 ms, 16 and 33Hz). Scale bars, 50 μV, 200 ms. (c) Raster plot and peri-stimulus time histogram (PSTH, bin size, 1 ms) for laser-evoked spikes of an example ChR2-tagged neuron. Dashed line, laser onset time. (d) Distribution of P values of Kolmogorov-Smirnov (K-S) test for all 85 optogenetically identified BF neurons. Colored circle, K-S test of spike timing distribution before and after laser onset for each neuron (cell types are color coded). Gray circles, K-S test after random shuffling of laser onset time. Dashed line, P = 0.0005. (e) Distribution of latency of laser-evoked spiking for the 85 neurons. The latency was measured by change point analysis (see Methods). (f) Waveform comparison between laser-evoked and spontaneous spikes. Upper panel, averaged waveforms of laser-evoked spikes (blue) and spontaneous spikes (gray) of an example neuron. Lower panel, distribution of correlation coefficient between laser-evoked and spontaneous spike waveforms for all 85 optogenetically identified BF neurons.

