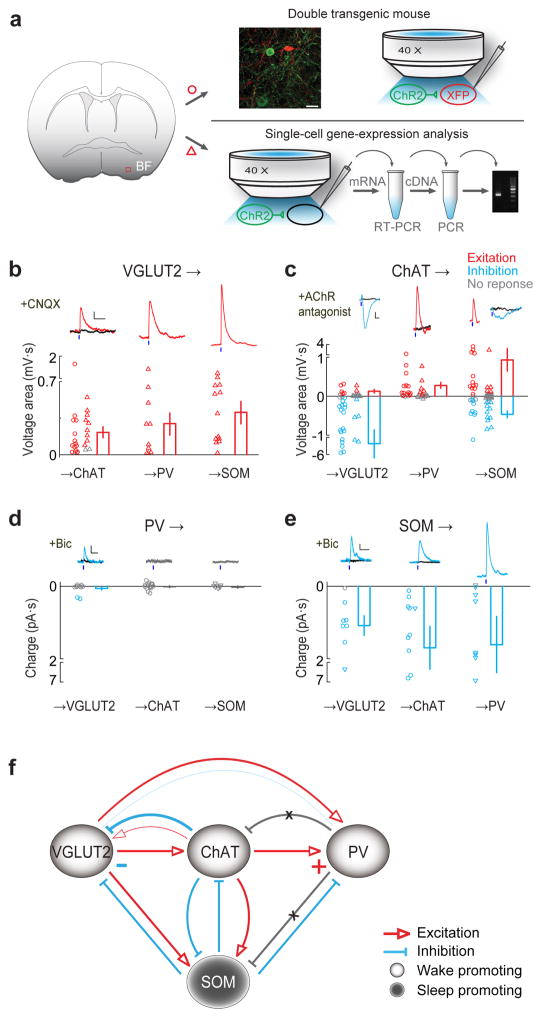
Figure 5.
Local connectivity of BF cell types. (a) Schematic of slice experiment using two strategies. The first strategy (upper right) is to use double transgenic mice. Shown are fluorescence image of a small BF area (red box in coronal diagram) showing ChR2-eYFP-expressing ChAT+ neurons (green) and tdTomato-expressing PV+ neurons (red) in an example experiment. Scale bar, 30 μm. Blue light was used to activate ChR2-expressing (presynaptic) neurons and whole-cell recordings were made from fluorescently labeled postsynaptic neurons. The second strategy (lower right) requires single-cell gene-expression analysis. Recordings were made from unlabeled neurons and the cell type is identified using RT-PCR. (b–e) Synaptic interactions between multiple pairs of pre- and postsynaptic cell types. (b) VGLUT2+ to ChAT+, PV+ and SOM+ neuron connections. Top, example light-evoked excitatory responses (red) recorded under current clamp, blocked by AMPA receptor antagonist CNQX (10 μM, black traces). Short blue bar, light pulse (5 ms). Scale bars, 1 mV, 200 ms. Bottom, population summary of input strength (measured by voltage area, integral of EPSP), each circle (using double transgenic mice) or triangle (based on single-cell gene-expression analysis, performed in the presence of mAChR, nAChR antagonists) represents one cell. Red, significant excitatory response (P < 0.05, t-test); Gray, no significant response. Error bar, ± s.e.m. (c) Similar to b, for ChAT+ to VGLUT2+, PV+ and SOM+ connections (recorded under current clamp). Blue, significant inhibitory response (P < 0.05); black, after application of AChR antagonists. ChAT→VGLUT2 excitatory response was blocked by nAChR antagonists MLA (methyllycaconitine, α7-containing nAChR antagonist, 5 nM) and DhβE (dihydro-β-erythroidine, non-α7 nAChR antagonist, 500 nM), inhibitory response blocked by mAChR antagonist scopolamine (20 μM). ChAT→PV response was blocked by MLA + DhβE. ChAT→SOM excitatory responses were blocked by MLA, DhβE and scopolamine, and inhibitory responses were blocked by scopolamine. Scale bars, 1 mV, 200 ms. All experiments indicated by triangle were performed in the presence of glutamate and GABA receptor antagonists. (d) PV+ to VGLUT2+, ChAT+ and SOM+ connections (voltage clamp). Among all recorded neurons (VGLUT2+, n = 11; ChAT+, n = 17; SOM+, n = 8), inhibitory responses were detected only in two VGLUT2+ neurons, which were blocked by GABAA receptor antagonist bicuculline (‘bic’, 20 μM, black trace). Scale bars, 10 pA, 50 ms. (e) SOM+ to VGLUT2+, ChAT+ and PV+ connections (voltage clamp). All inhibitory responses (blue) were blocked by bicuculline (black). Scale bars, 10 pA, 50 ms. (f) Diagram of BF local circuit. Light circles, wake-promoting neurons. Dark circle, sleep-promoting SOM+ neurons (containing both wake/REM-active and NREM-active neurons). Excitatory and inhibitory connections are indicated by red and blue lines, respectively. Gray line with cross indicates tested connection with no detectable response. Connection strength is represented qualitatively by line thickness.

