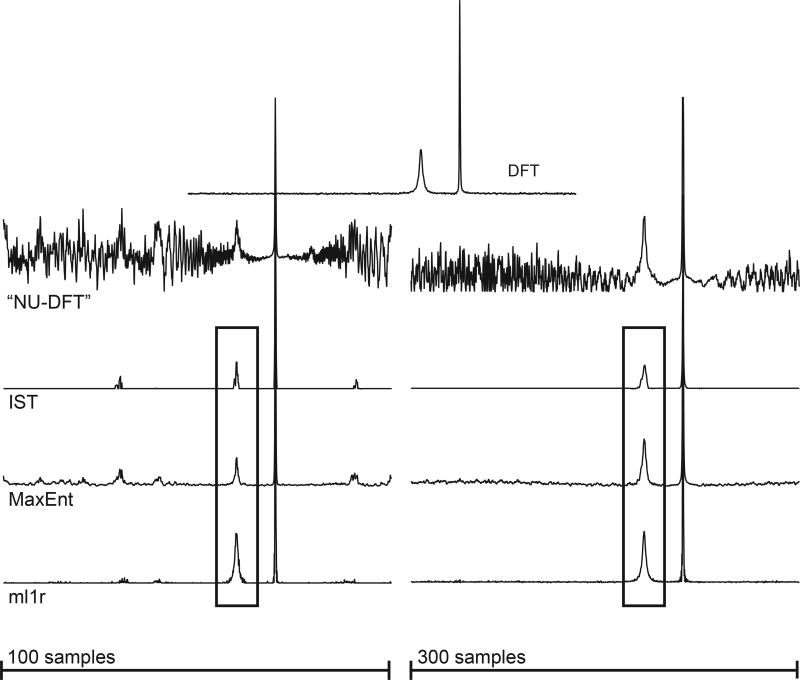
Figure 1.
Top row: DFT of 1024-point synthetic data plus noise (noise RMS = 0.1). Successive rows: spectral estimates employing 100 (left) and 300 (right) samples according to an exponentially biased sampling scheme (see supplementary information). The value of aim was 10−3 for all IST, MaxEnt, and ml1r spectra. The peaks enclosed by rectangles are expanded in Figure 3.

