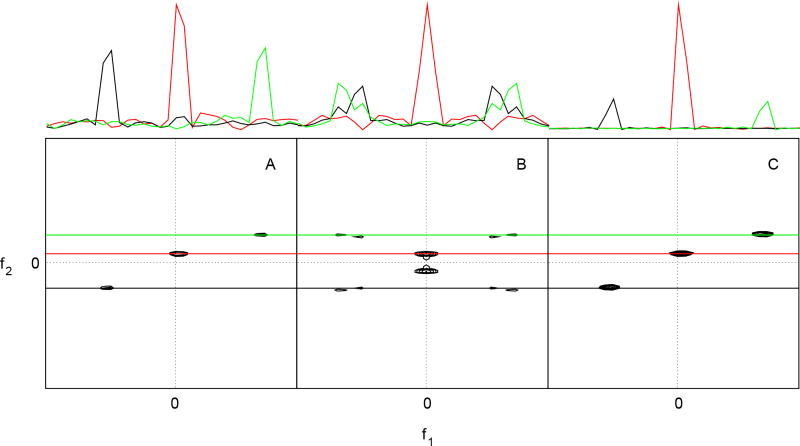
Figure 2.
Two-dimensional cross-sections from a four-dimensional N,C-NOESY spectrum, obtained from (A) uniformly sampled hypercomplex (States-Haberkorn-Ruben) data, (B) real values only in the indirect dimensions, and (C) using random phase detection. One-dimensional cross-sections at the frequencies depicted by colored lines crossing the contour plots are depicted at the top. Reprinted with permission from Maciejewski et al. (2011).46

