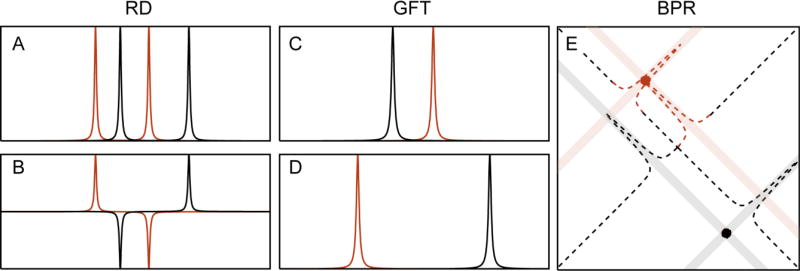
Figure 5.
Schematic depiction of RD, GFT and BPR. (A) The RD method gives rise to chemical shift multiplets, which are separated by the chemical shift of one nucleus (ω2) and centered at the chemical shift of the other nucleus (ω1). In GFT processing of RD data, the phases are manipulated (B) so that their combination results in “basic spectra” of reduced complexity (C–D). In projection spectroscopy the delays are scaled by a projection angle. The resulting spectra can be directly projected onto the higher dimensional plane, where an intersection in this higher dimensional spectrum reveals the true chemical shifts (X marks the spot).

