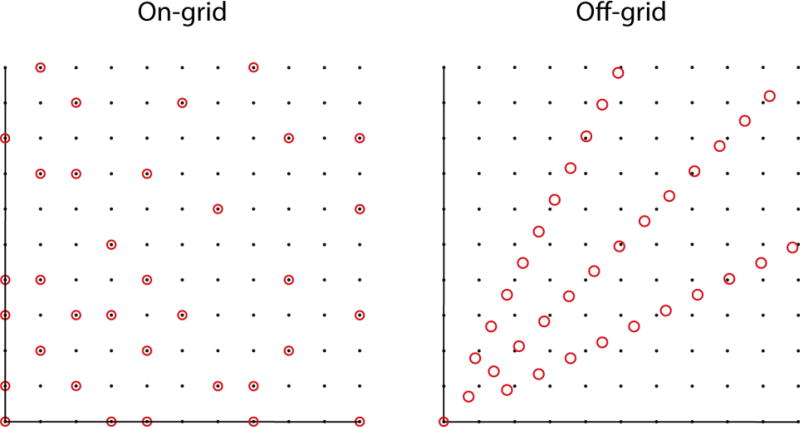
Figure 6.
Sampling grid showing on- and off-grid sampling of the same number of points (circles). The off-grid samples are according to radial sampling and the on-grid samples are distributed randomly. The distances between the radial points are sufficient to reconstruct the same spectral window as the underlying grid (black dots) without aliasing.

