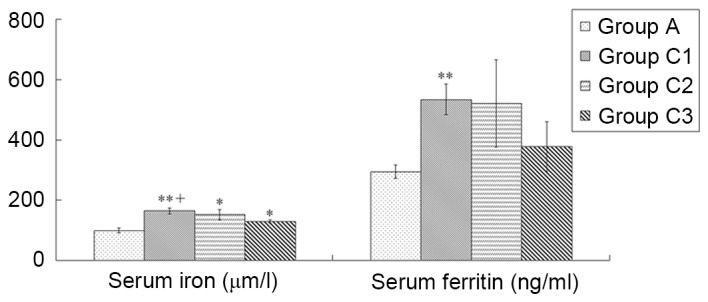
Figure 1.

Comparison of iron loads between iron-overloaded models of different dosage regimens. According to the injection frequency and single dose volumes, mice were divided into three iron overload groups (C1-C3), with the administration of iron dextran 200 mg/kg/week for 10 weeks, 250 mg/kg/week for 8 weeks and 333 mg/kg/week for 6 weeks, respectively. Normal controls in group A were administered the equivalent volume of normal saline. Data are presented as the mean ± standard error of the mean (n=8). *P<0.05, **P<0.01 vs. group A; +P<0.01 vs. group C3.
