
Figure 3.
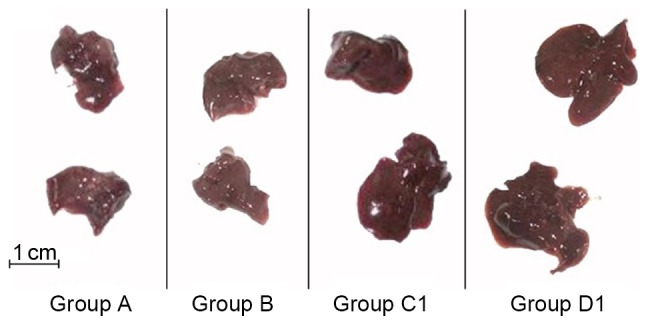
General morphology of spleens in all groups. Larger spleen volumes were observed in groups C1 and D1 compared with groups A and B. A, normal control; B, aplastic anemia; C1, iron overload; D1, composite model.
Official websites use .gov
A
.gov website belongs to an official
government organization in the United States.
Secure .gov websites use HTTPS
A lock (
) or https:// means you've safely
connected to the .gov website. Share sensitive
information only on official, secure websites.
General morphology of spleens in all groups. Larger spleen volumes were observed in groups C1 and D1 compared with groups A and B. A, normal control; B, aplastic anemia; C1, iron overload; D1, composite model.