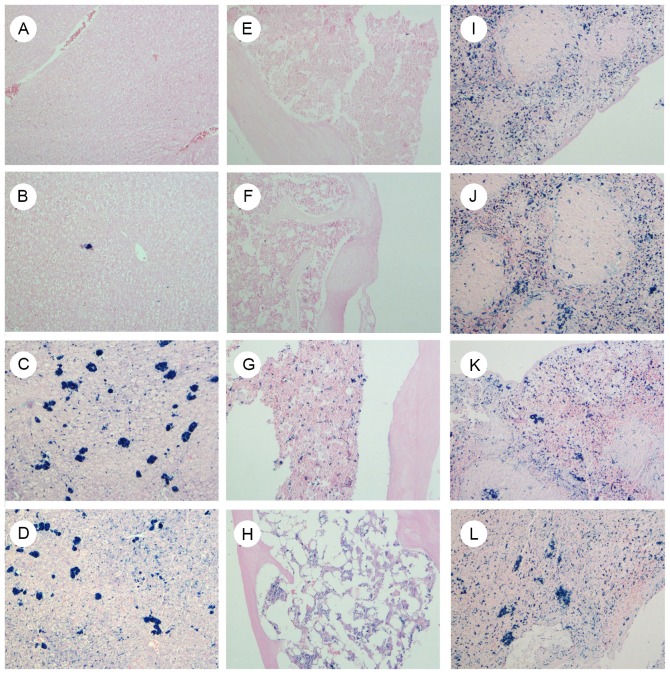
Figure 5.
Iron deposition of multiple organs in groups A, B, C1 and D1. Following prussian blue staining, slides were redyed with Sudan red, observed under a light microscope and images were captured at ×400 magnification. Images show (A-D) liver, (E-H) bone marrow and (I-L) spleen tissues in groups A, B, C1 and D1, respectively. Markedly increased iron deposits were observed in liver and bone marrow of groups C1 and D1, but not in groups A and B. A, normal control; B, aplastic anemia; C1, iron overload; D1, composite model.

