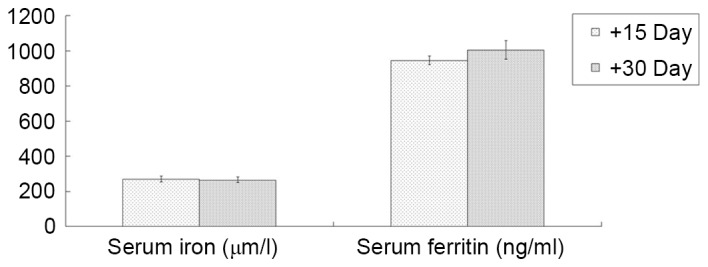
Figure 7.

Comparison of serum iron and ferritin level changes in the composite model group. Serum iron and ferritin levels in the composite model group were detected on days +15 and +30. Data are presented as the mean ± standard error of the mean (n=4).
