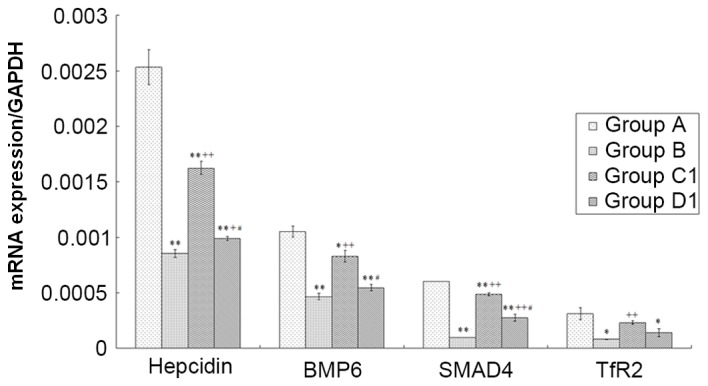
Figure 8.

Analysis of hepcidin, BMP6, SMAD4 and TfR2 mRNA expression levels among different groups. Total mRNA was isolated and reverse transcribed to cDNA, following which a reverse transcription-quantitative polymerase chain reaction protocol was performed. Data are presented as the mean ± standard error of the mean (n=8). *P<0.05, **P<0.01 vs. group A; +P<0.05, ++P<0.01 vs. group B; #P<0.01 vs. group C1. A, normal control; B, aplastic anemia; C1, iron overload; D1, composite model; BMP6, bone morphogenic protein 6; SMAD 4, SMAD family member 4; TfR2, transferrin receptor 2.
