
Figure 5.
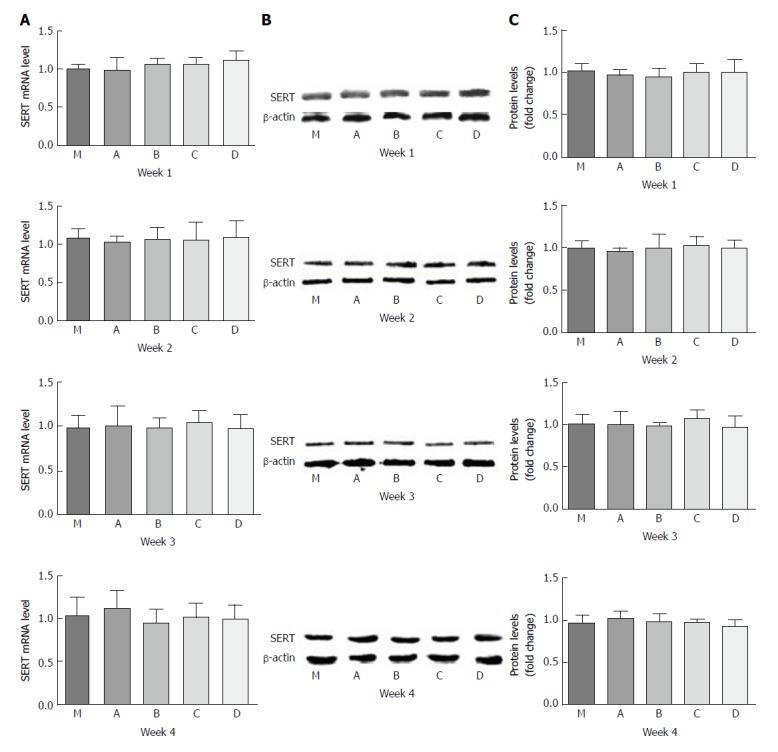
Effect of LGG-s on SERT mRNA and SERT-P expression in rat brain tissues. A: SERT mRNA levels at the first, second, third, and fourth weeks; B: SERT-P levels at the first, second, third, and fourth weeks analyzed by Western blot; C: Quantitative analysis of SERT-P levels at the first, second, third, and fourth weeks analyzed by Western blot. Control group, n = 5; PI-IBS group, n = 5, each week.