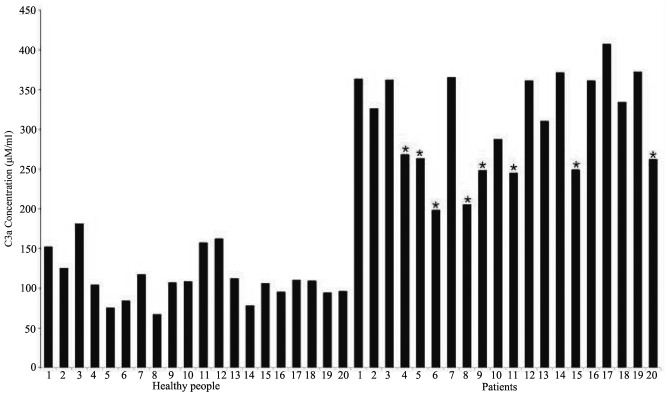
Figure 5.
Concentrations of C3a in different serum samples determined by ELISA. The first 20 bars represent the C3a concentrations in healthy participants, whereas the remaining bars represent those in esophageal cancer patients (P<0.01). *sera from esophageal carcinoma patients undergoing chemotherapy and surgery.

