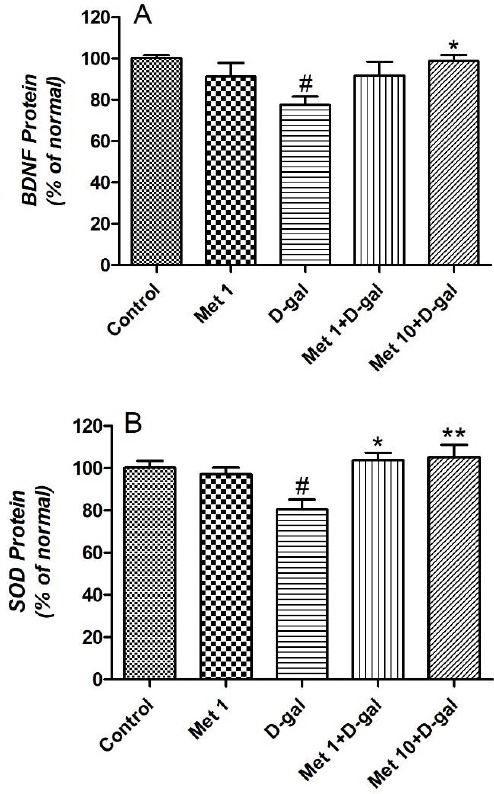
Figure 3.

(A) The effect of metformin (1 and 10 mg/kg for 6 weeks) on BDNF and (B) brain SOD levels of D-galactose-induced aging mice. Values are expressed as mean±SEM (n=10 in each group). # P<0.05 compared to the control group. * P<0.05 and ** P<0.01 compared to the D-gal group
