Figure 1.

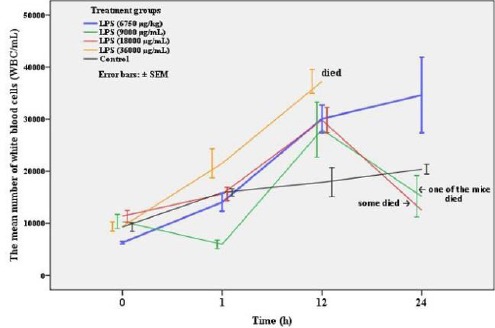
Time-course changes in white blood cells count (mean ± SEM) of mice treated with different doses of LPS including 36000, 18000, 9000, and 6750 µg/kg B.W and the control group

Time-course changes in white blood cells count (mean ± SEM) of mice treated with different doses of LPS including 36000, 18000, 9000, and 6750 µg/kg B.W and the control group