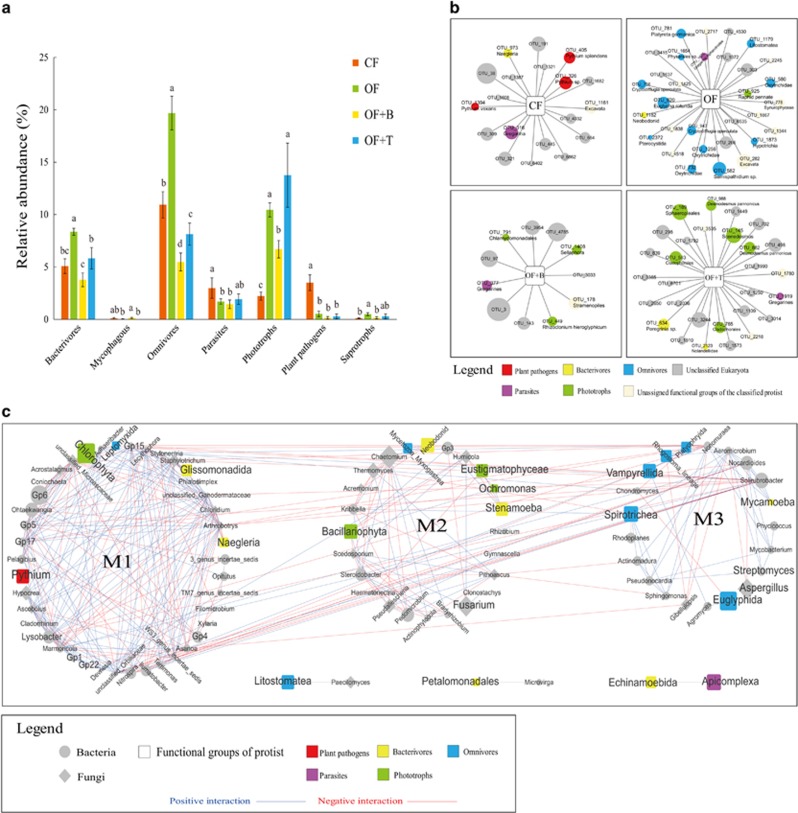
Figure 2.
Protists form a functional and dynamic hub in the soil microbiome induced by fertilizations. (a) Overview of the relative abundance of protist functional groups in the four fertilizer treatments. CF, chemical fertilizer; OF, organic matter fertilizer; OF+B, Bacillus enriched organic fertilizer; OF+T, Trichoderma enriched organic fertilizer. Different letters above the bars indicate a significant difference at the 0.05 probability level according to the Tukey’s test. (b) Protist indicator OTUs for the four fertilizer treatments. Circles represent protist OTUs and circle sizes correspond to their average relative abundance (log transformation) across all the samples. (c) Correlation-based network analysis showing potential interactions between abundant bacterial and fungal genera as well as protist functional groups. The node size is proportional to a taxon’s average relative abundance (log transformation) across all the samples. Lines connecting nodes (edges) represent positive (blue) or negative (red) co-occurrence relationships.

