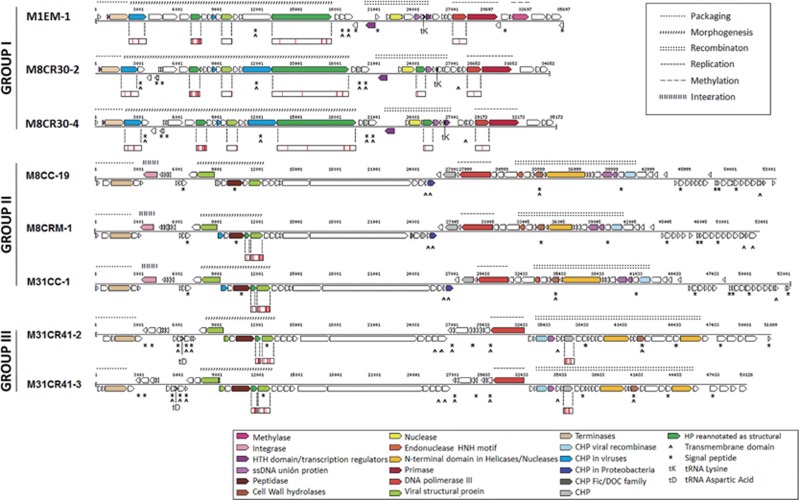
Figure 3.
Genomic organization of Salinibacter ruber viruses. The genome of each virus is represented with a line and ORFs are represented with arrows. Every ORF is colored according to its predicted function (see legend). ORFs with transmembrane segments or signal peptides are labeled with ^ and *, respectively. Proteins detected using LC-MS/MS are represented as small boxes below the corresponding ORF, with red bars marking the detected parts.

