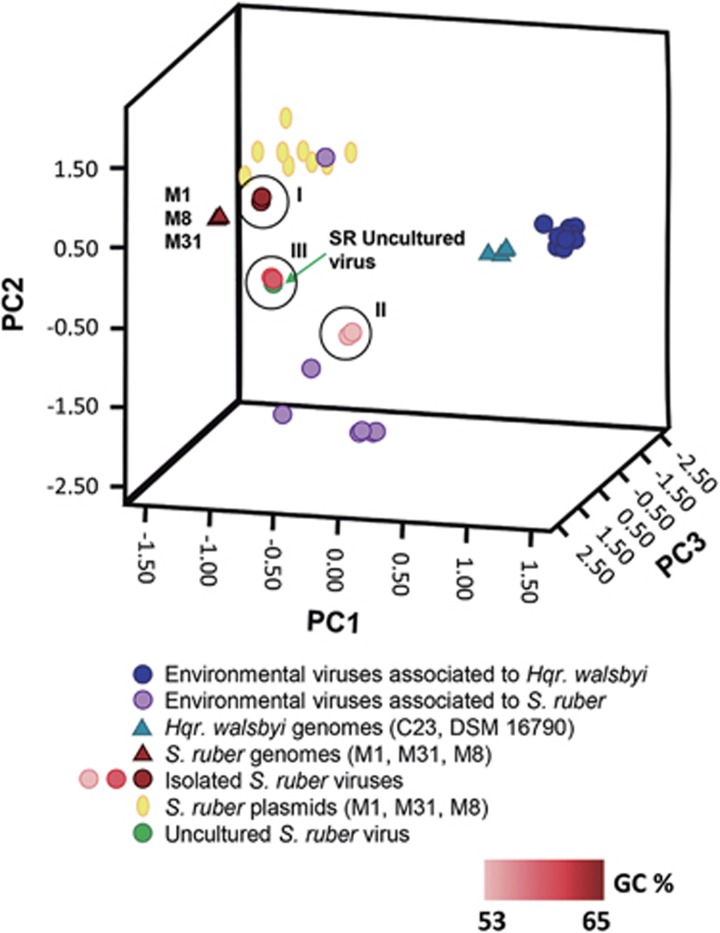
Figure 4.
principal component analysis of the tetranucleotide frequencies in S. ruber strains and their isolated and environmental viruses as well as S. ruber and Hqr. walsbyi strains and environmental viruses. The viruses isolated in this work are colored in increasing shades of red, according to their GC content.

