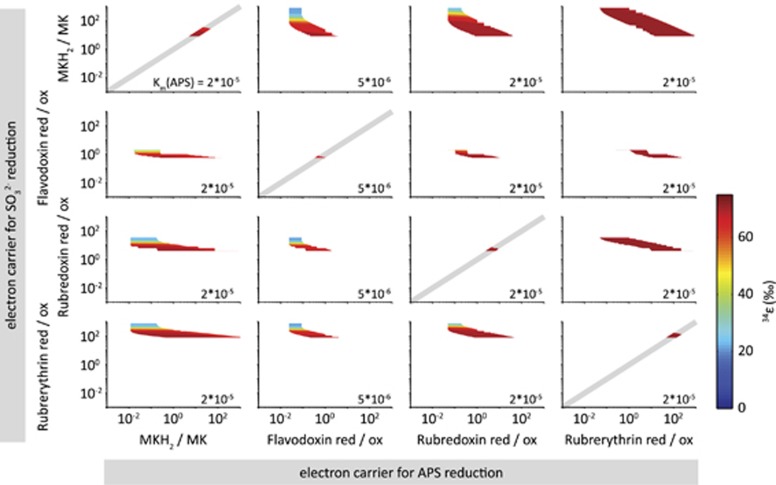
Figure 5.
The range of Rr/o yielding reasonable (1 nM–1 mM) intracellular metabolite concentrations. Results are shown only for electron carriers that allow near-thermodynamic fractionations at low csSRR. Columns and rows show electron carriers for APS and SO32− reduction, respectively. White space indicates combinations of Rr/o that produce unreasonable intracellular metabolite concentrations over some or all of the range of csSRR accessed in culture experiments (0.1 to 125 fmol H2S per cell per day). Colored contours indicate the magnitude of net isotope fractionation at a csSRR of 0.1 fmol H2S per cell per day and with values of KM for APS at Apr shown in the lower right corner of each panel. Other KM were at their default values (Supplementary Table S5). When the same electron carrier is involved in both APS and SO32− reduction (on the diagonal), the possible range of Rr/o is further constrained to be on the solid grey line.

