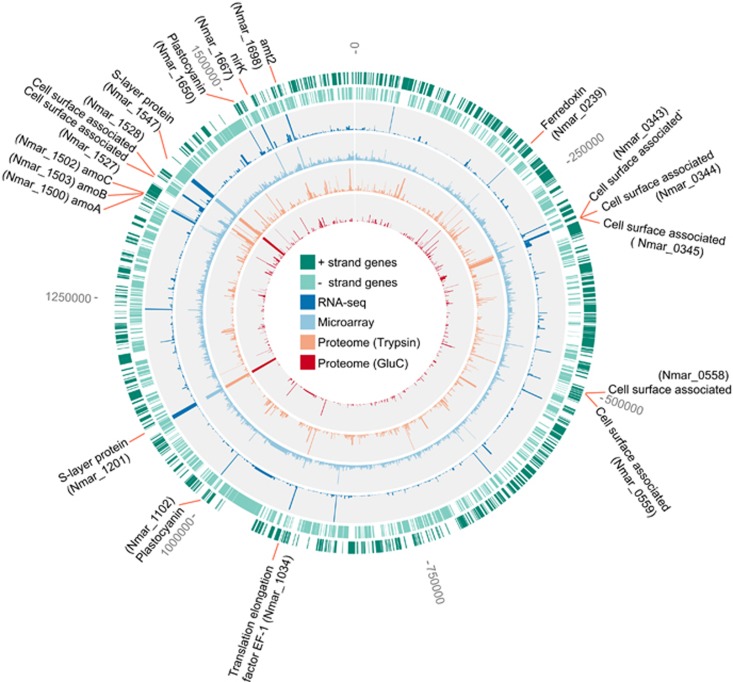
Figure 1.
The global transcriptome and proteome of exponential phase N. maritimus. The first and second outermost rings (dark and light green) indicate the open reading frames (ORFs) on the positive and negative strands, respectively. The third and fourth rings (dark and light blue; histogram) are the relative abundance of transcripts mapped onto the genome based on the transcript read counts and hybridization florescence intensity, respectively. The fifth and sixth rings (orange and red; histogram) are the relative abundance of proteins based on the spectral counts detected in the trypsin and GluC based proteomes, respectively. The position and accession number of the most highly expressed genes in both protein and transcript levels are highlighted along the genome.

