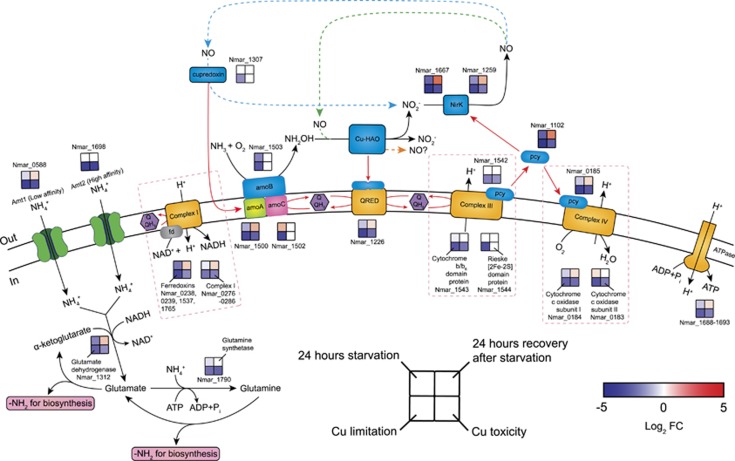
Figure 2.
Transcriptional changes for genes participating in proposed pathways of ammonia oxidation, electron transfer and ammonia assimilation in response to ammonia starvation, recovery from starvation, Cu limitation, and Cu toxicity conditions. Log2 fold changes in expression are shown for the 24 h starvation vs exponential growth, 24 h recovery after ammonia re-addition vs 24 h starvation, Cu limitation vs Cu-replete and Cu toxicity vs Cu-replete conditions. Upregulation is represented in red (P<0.05), downregulation in blue, and no significant differential expression in white. Alternative models for ammonia oxidation and electron transfer are represented by the blue, green, and orange dashed arrows, highlighting the as yet unresolved centrality of NO in AOA biochemistry. A possible function of NO as an electron shuttle was earlier posited based on energetic considerations, and may also suggest a role in electron transfer by an ORF (Nmar_1501) of unknown function in the archaeal AMO operon (Stahl and de la Torre, 2012). In this model, NO is produced by the reduction of nitrite by Cu-NirK (Nmar_1259 and Nmar_1667). Subsequently, NO is re-oxidized to nitrite by a purple cupredoxin (Nmar_1307) delivering electrons to AMO (Hosseinzadeh et al., 2016), transfer possibly facilitated by Nmar_1501 (blue dashed arrow). Alternatively, NO is a co-reactant with NH2OH to form nitrite facilitated by an unknown Cu-containing protein (green dashed arrow) (Kozlowski et al., 2016). Finally, the orange dashed arrow highlights the possibility, as recently shown in the AOB (Caranto and Lancaster, 2017), that NO is the primary product of NH2OH oxidation. Red arrows indicate possible electron flow. Pink dashed boxes contain the subunits and corresponding expression patterns of complexes I, III and IV. The expression patterns of complex I and ATPase were assigned as the averaged log2 fold changes in expression for their subunits. The log2 fold changes in the transcript abundances of four ferredoxins (Nmar_0238, 0239, 1537 and 1765) were averaged to represent the expression pattern of the putative complex I associated ferredoxins. No complex I and ATPase subunits and ferredoxin genes were regulated in the opposite directions (see Supplementary Dataset 3 for the fold-expression and statistical significance of each treatment).

