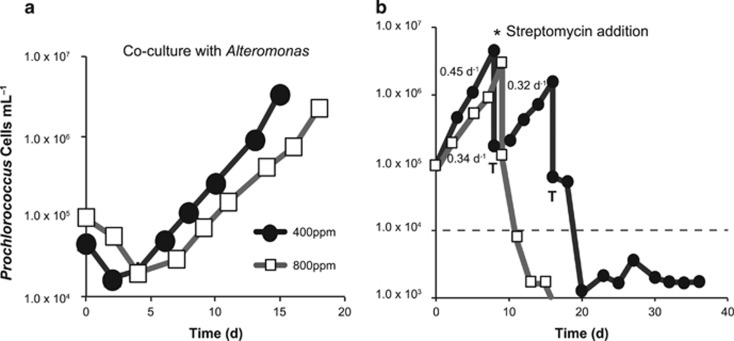
Figure 1.
Representative growth curves of Prochlorococcus under ambient and elevated CO2. (a) Cell density (cells ml−1) versus time (days) of Prochlorococcus (VOL4, MIT9312) in co-culture with Alteromonas (EZ55) at 400 p.p.m. (black circles) or 800 p.p.m. (white squares) CO2. Growth statistics are in Table 1. (b) Cell density of Prochlorococcus (VOL4, MIT9312) over consecutive transfers (indicated by ‘T’) in co-culture with Alteromonas (EZ55). The asterisk indicates addition of streptomycin rendering Prochlorococcus axenic, the dashed line indicates the limit of detection and the numbers are exponential growth rate constants (day−1) calculated from growth curves.

