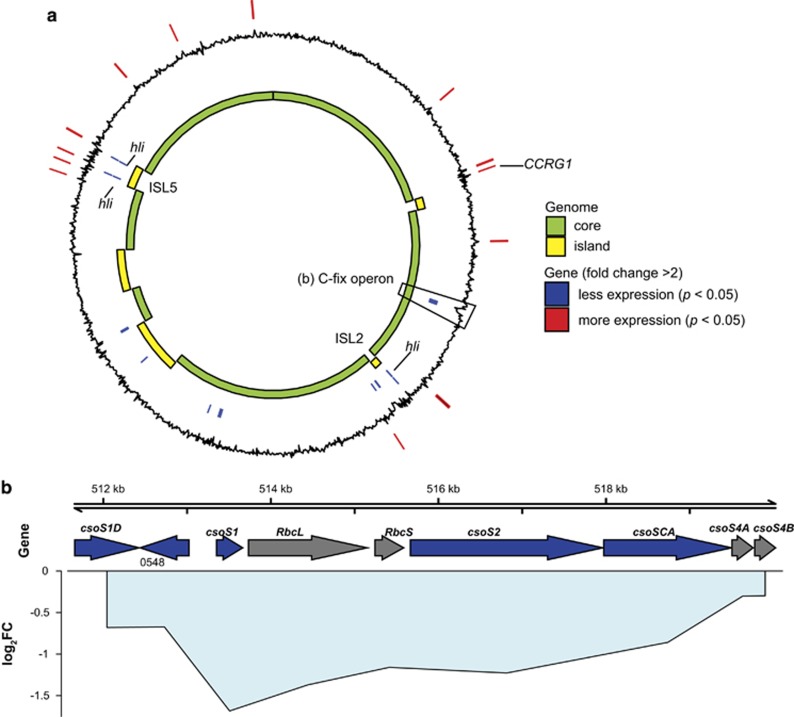
Figure 2.
Prochlorococcus differential gene expression under elevated CO2. (a) Whole-genome view of differentially expressed genes (n=35) in relation to core and flexible genome (that is, islands) for Prochlorococcus. Black line indicates log2 fold change in expression, with positive (outward) indicating genes with increased expression, and negative (inward) values indicating decreased expression under elevated CO2. Positions of significantly differentially expressed genes (pairwise exact test, P<0.05, n=6, with fold change >2) are indicated by lines on the outer ring (red) for genes with increased expression, and the inner ring (blue) for genes with decreased expression. (b) Region containing the putative operon with genes for carbon fixation (C-fix operon): Rubisco (RbcL, RbcS), carboxysome subunit genes (csoS1D, csoS1, csoS2, csoSCA, csoS4A and csoS4B). Arrows indicate location and strand of genes, primary colors indicate significant differential expression (P<0.05, n=6, blue=decreased, gray= no significant difference) under elevated CO2, lines indicate the mean log2 fold change (log2FC) of each gene, centered on each gene’s position in the genome, and are filled with light blue (decreased expression) to indicate cohesiveness of fold change across multiple genes.

