Figure 4.
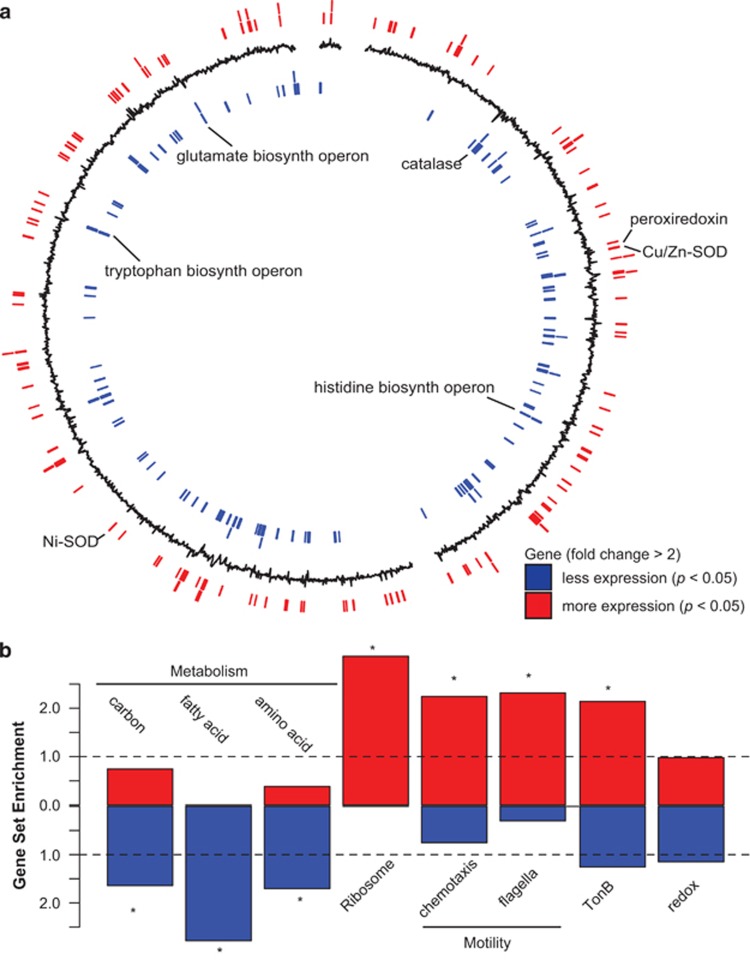
Alteromonas differential gene expression under elevated CO2. (a) Whole-genome view of differentially expressed genes for Alteromonas (strain EZ55). Black line indicates log2 fold change in expression, with positive (outward) indicating genes with increased expression, and negative (inward) values indicating decreased expression under elevated CO2. Positions of significantly differentially expressed genes (pairwise exact test, P<0.05, n=6, with fold change >2) are indicated by lines on the outer ring (red) for genes with increased expression, and the inner ring (blue) for genes with decreased expression. Select genes and putative operons are labeled. (b) Gene set enrichment analysis of differentially expressed genes (P<0.05, n=6), with increased expression (red) or decreased expression (blue) for KEGG categories of carbon, amino-acid and fatty acid metabolism, ribosome, chemosynthesis, and flagellar genes, as well as categories defined by annotation keyword: TonB and redox (Supplementary Table 5). Dashed line indicates expected ratio of genes in a set based on the number of genes within the same set in the genome, asterisk indicates the gene set is significantly enriched (hypergeometric test, P<0.05) compared with the expected value of random selection from the genome.

