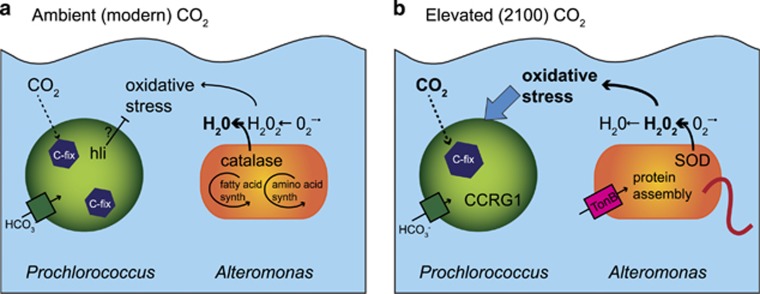
Figure 5.
Conceptual model of the interaction of Prochlorococcus and Alteromonas under ambient and elevated CO2. Prochlorococcus cell in green and Alteromonas cell in orange under (a) ambient, modern CO2 and (b) elevated CO2 predicted for 2100. Arrows indicate putative fluxes or transformations of metabolites, both passive (dashed), active (solid), and inhibitory (flat head arrow). Relative increases in fluxes or transformations indicated by bold arrows and text. The thick red line on Alteromonas represents flagellar and chemotaxis gene expression. high light induced (hli), CCRG1, superoxide dismutase (SOD), TonB-dependent transporters and related genes (tonB).

