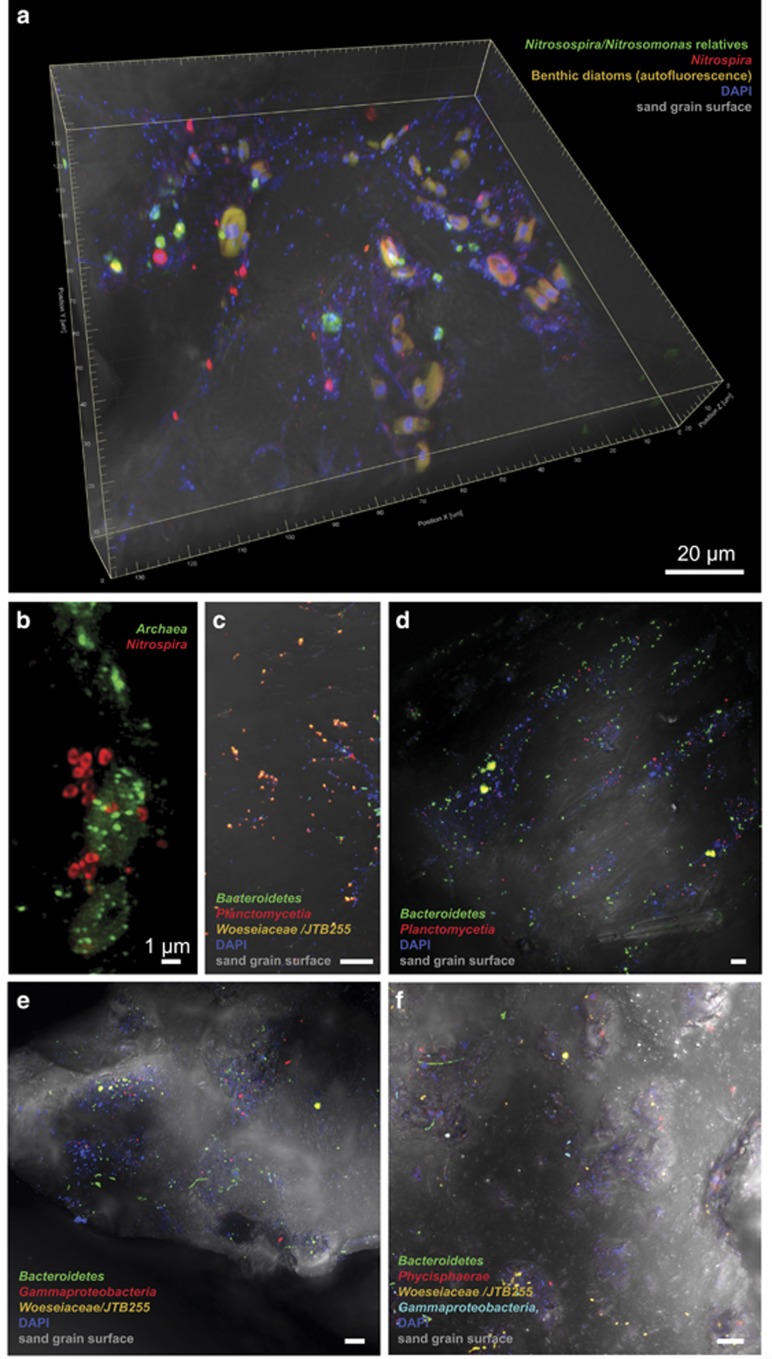
Figure 4.
Direct visualization of taxa on sand grains using CARD-FISH and confocal laser scanning microscopy. Targeted taxa are indicated in the individual panels a to f. DAPI signal (in blue) shows all cells not targeted by the probes. All images (except for b) are composite micrographs of fluorescent signals and transmitted light of the sand grain’s surface. Micrograph a is also available as a video in the Supplementary Information showing the microbial colonization of protected and exposed areas in the three-dimensional space. Micrograph b is a superresolution structured illumination image (SR-SIM). If not otherwise indicated, scale bar refers to 10 μm. Probes used are listed in Supplementary Table S1.

