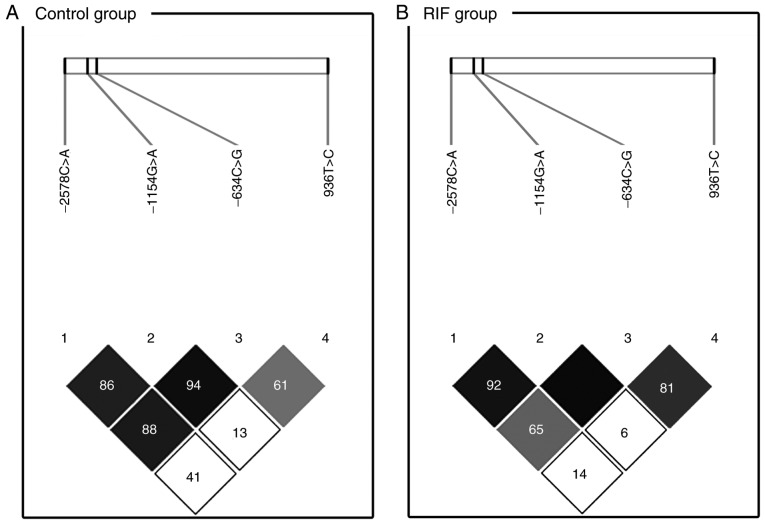
Figure 1.
LD patterns of VEGF single nucleotide polymorphisms. The values in the squares denote LD between single markers. (A) Control subjects exhibited strong LD between loci VEGF −1154G>A (rs1570360) and −634C>G (rs2010963; D'=0.945), VEGF −2578C>A (rs699947) and −1154G>A (rs1570360; D'=0.863) and VEGF −2578C>A (rs699947) and −634C>G (rs2010963; D'=0.885). (B) Patients with recurrent implantation failure exhibited strong LD between loci VEGF −2578C>A (rs699947) and −1154G>A (rs1570360; D'=0.923) and between VEGF −1154G>A and −634C>G (D'=1.000). Dark squares indicate high r2 values and light squares indicate low r2 values. LD, linkage disequilibrium; VEGF, vascular endothelial growth factor.

