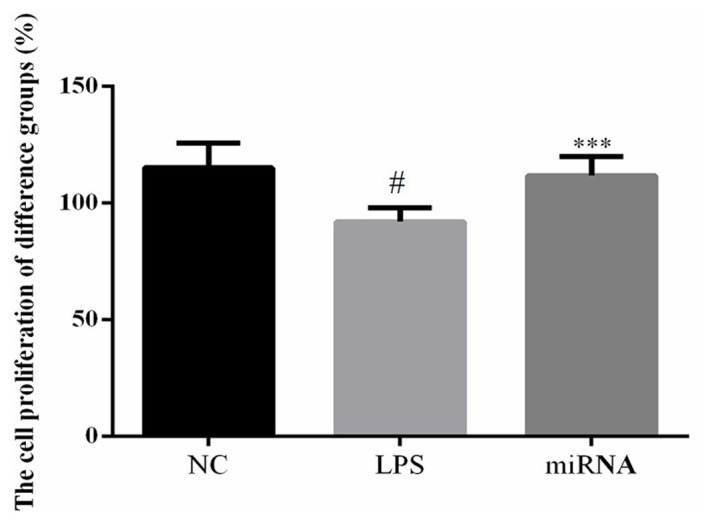
Figure 1.

Cell proliferation rate in H9c2 cells, determined by MTT assay. Cells were treated by 40 µg/ml LPS, or by 40 µg/ml LPS followed by miR-30a-3p transfection. #P<0.05 vs. the NC group; ***P<0.05 vs. the LPS group. LPS, lipopolysaccharide; miR, microRNA; NC, normal control.
