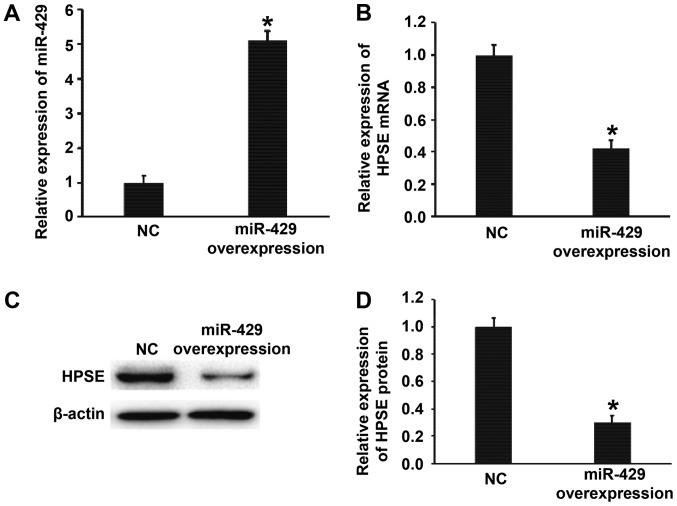
Figure 3.
Effect of miR-429 on the expression of HPSE in BGC-823 cells. (A) Relative expression of miR-429 in BGC-823 cells of NC and miR-429 overexpression groups. (B) Relative expression of HPSE mRNA in BGC-823 cells of NC and miR-429 mimics groups. (C and D) Relative expression of HPSE protein in BGC-823 cells of NC and miR-429 mimics groups. Quantitative polymerase chain reaction was used to determine the expression of miR-429 and HPSE mRNA, and western blotting was employed to measure HPSE protein expression. *P<0.01 compared with NC group. miR, microRNA; HPSE, heparanase; NC, negative control.

